Today we are fortunate to have a guest contribution written by Kim Kowalewski, formerly Senior Adviser in the Macroeconomic Analysis Division of the Congressional Budget Office.
The inversion of the yield curve this year has led to a considerable debate about its recessionary signal. Some analysts, including the former chairman of the Federal Reserve, Janet Yellen, think that the recent inversion doesn’t signal a recession in the coming year because they believe that the term premium in long-term interest rates has been pushed down by an unusual set of factors: the quantitative easing policies in the United States, Japan, and Europe, by safe-haven demands for Treasury securities, and by a low risk of an increase in inflation.[1] That is, those unusual factors have led to an unusual inversion of the yield curve this year. Other analysts believe that the yield curve has signaled a significant risk for a recession in the coming year.[2]
I examine just how unusual is the inversion of the yield curve this year. I don’t try to estimate the impact of those unusual factors on the shape of the yield curve (or equivalently, the magnitude of the term spread). Instead, I simply parse the data to see what may be unusual about the recent inversion. I consider both how the yield curve has inverted in the past year and when it has inverted. My findings suggest that the inversion this year has not been particularly unusual.
How the Yield Curve Has Inverted
What I mean by how the yield curve has inverted is how the long and short ends of the yield curve have changed as compared with past inversion episodes. If the long end has been pushed down by an unusual set of forces, then the change in the long end might bear an abnormal relationship to the change in the short end during the inversion episode this year.
The data are monthly values of the constant-maturity, 10-year Note rate and the secondary market, 3-month Bill rate.[3] I use the spread of those rates because researchers at the Federal Reserve Bank of San Francisco found that spread to be the best predictor of recessions.[4]
I examine how the yield curve has inverted during eight episodes since the early 1970s. The end of an episode is the lowest value of the term spread for the episode and the beginning as the previous peak value of the spread, ignoring temporary (within a year) and relatively small (less than 60 basis points) reversals of the spread. Of the eight episodes, six end when the term spread was negative on a monthly average basis, and two, one in the late 1980s and the other in the late 1990s, end when the term spread was a very small positive value on a monthly average basis. I consider the latter two episodes to be inversions because the term spread was negative on a number of days around the month when the term spread was at the local minimum.[5] In many cases, the previous peak is not the maximum value during the expansion in order to abstract from cyclical forces acting on the term spread in recovery and early expansionary periods. While the beginning months of the episodes are somewhat arbitrary, the qualitative results are not sensitive to the choice of beginning month. The inversion episodes are shown in black in the figure below (the shaded bars indicate recessions as defined by the National Bureau of Economic Research).
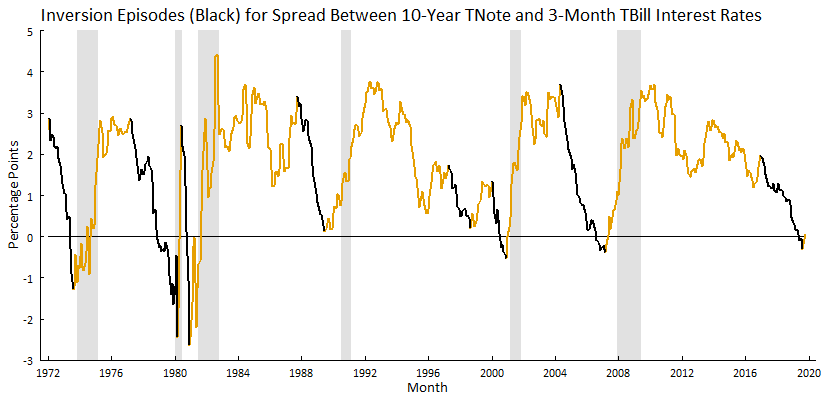
With the episodes identified, I calculate the component changes in the two interest rates from the beginning to the end of each episode. For example, in the case of the recent episode, the end (so far) occurred in August 2019, when the term spread was ‑0.32, and the beginning of the inversion occurred in December 2016, when the spread was 1.98. During the recent episode, the 10-year Note rate fell from 2.49 to 1.63, and the 3-month Bill rate rose from 0.51 to 1.95.
I show the changes in the 10-year Note rate and corresponding changes in the 3-month Bill rate for the eight episodes in the scatterplot below. The y-axis shows the change in the 10-year Note rate and the x-axis shows the corresponding change in the 3-Month Bill rate. The data labels indicate the beginning and ending months of each episode. The scatterplot also shows the linear regression line based on all but the latest episode in the estimation sample.
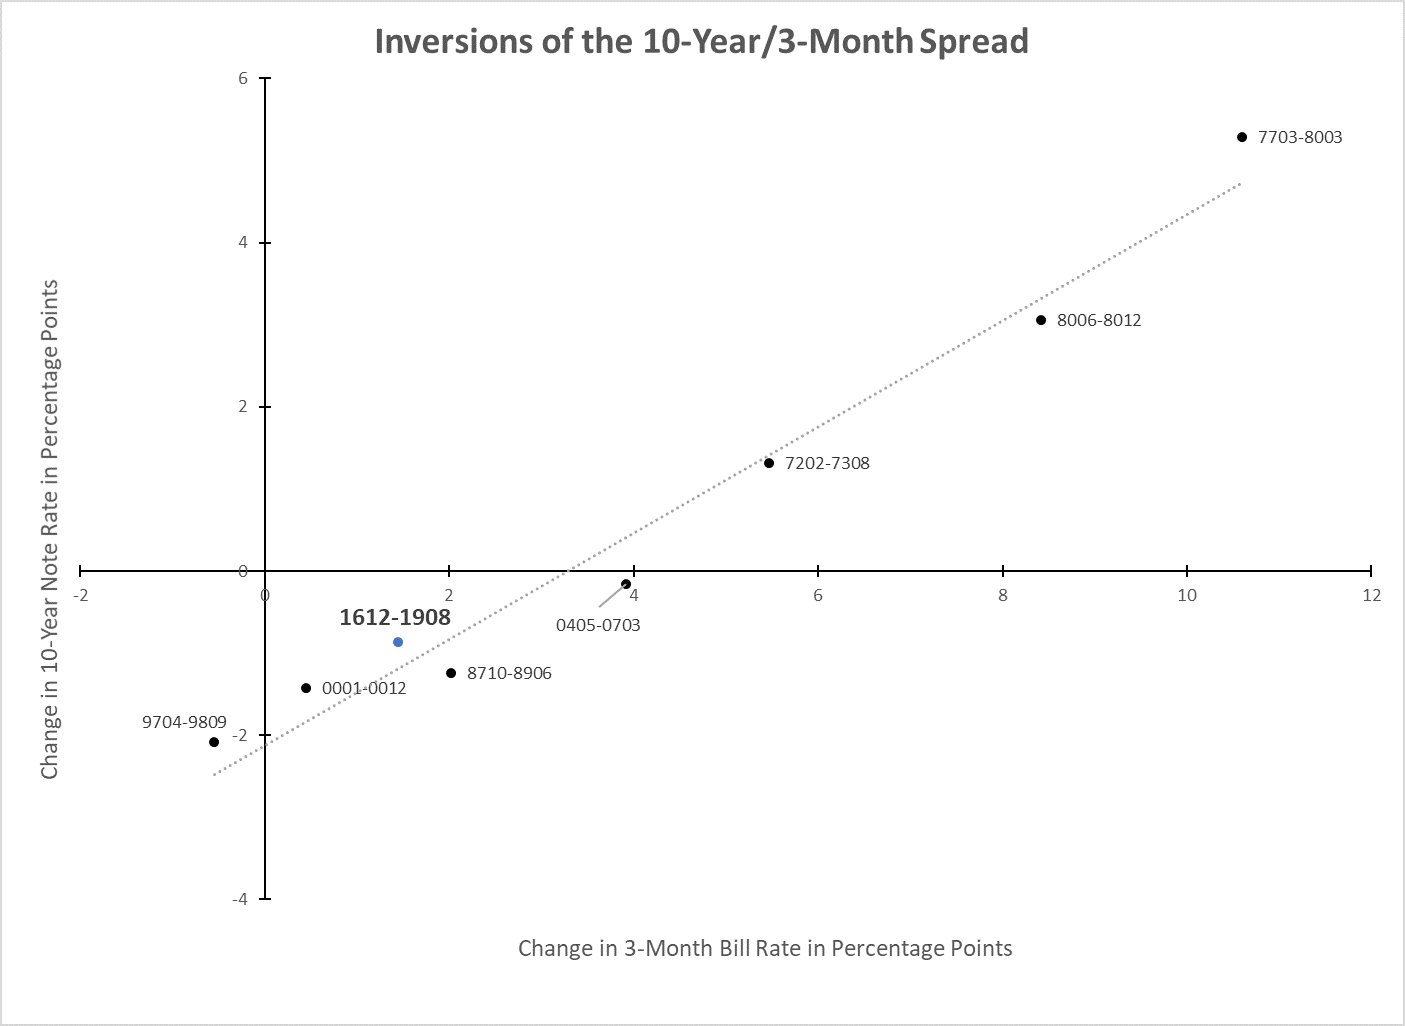
That rather surprising figure makes two points. The obvious point is that there is a remarkably close relationship between the changes in the two rates during the inversion episodes. That relationship appears to hold for inversion episodes when the 10-year Note rate rose, as it did during the episodes before the late 1980s, and when the 10-year Note rate fell, as it did during the episodes since the late 1980s. I found that result very surprising given the many changes in financial markets and international capital flows since the early 1970s.
The second point is that the change in the 10-year Note during the latest episode (point labeled “1612-1908”) is close to the estimated relationship.[6] In other words, the change in the 10-year Note rate during the latest inversion doesn’t appear to be unusual given the change in the 3-month Bill rate. It’s true that the 10-year Note rate declined during the recent episode, but it also declined during the other episodes since the late 1980s. The finding suggests that the unusual factors cited earlier did not have much of an impact on the change in the 10-year Note rate in the latest episode or were offset by other factors.
When the Yield Curve Has Inverted
What I mean by when the yield curve has inverted is the state of the business cycle at the time of the inversion. If the recent inversion has been abnormal, then it might bear a different relationship to the state of the economy than in the past.
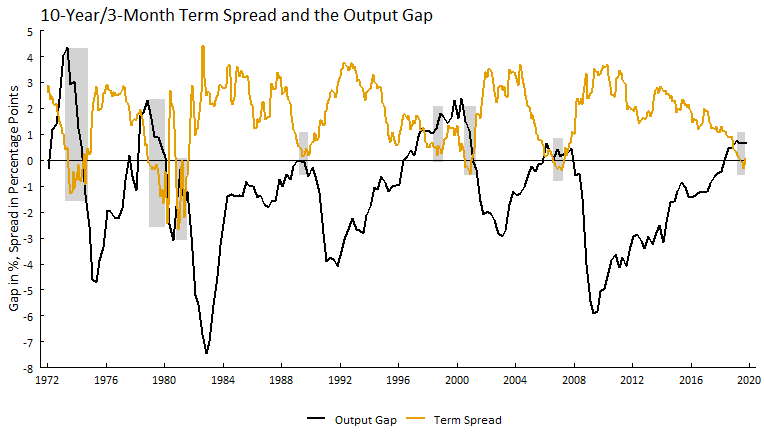
I measure the state of the business cycle using an estimate of the output gap (the percentage difference of actual output from potential output) by the Congressional Budget Office.[7] When the output gap is positive, meaning that actual output is greater than potential output, the economy is strong. When the output gap is negative, as it is during recessions, the economy is weak.
The figure below shows that the economy was relatively strong when the yield curve was inverted or nearly inverted on a monthly average basis.[8] During periods (the shaded areas) when the term spread was negative or close to zero, the output gap was positive or close to zero. In the past year, the inversion of the term spread also coincided with a positive output gap, indicating that the recent inversion is not necessarily unusual given the state of the business cycle.
Conclusion
My simple data analysis suggests that the inversion this time is not so different. It is by no means definitive, of course, but the case for an abnormal inversion this year would have been stronger with findings opposite of mine. My analysis also suggests that we should not dismiss the estimates of recession probabilites over the coming year using the 10-year Note/3-month Bill spread.
Notes
[1] See https://video.foxbusiness.com/v/6073868130001/#sp=show-clips.
[2] Menzie Chinn showed that the slope of yield curve still is a good recession predictor after taking account of the term premium: (https://econbrowser.com/archives/2019/08/an-ad-hoc-term-premium-adjusted-term-spread-recession-model). Note that his adjustment uses the whole term premium, not just the portion due to the unusual factors. Menzie’s latest recession probabilities are here: https://econbrowser.com/archives/2019/11/recession-probabilities-september-october-2020. Campbell Harvey is skeptical of the view that ‘this time is different’: https://www.linkedin.com/pulse/time-different-yeah-right-campbell-harvey/. Researchers at the Federal Reserve Bank of San Francisco also found that the term spread adjusted for the (whole) term premium is a less accurate predictor of recessions than is the unadjusted term spread: (https://www.frbsf.org/economic-research/publications/economic-letter/2018/august/information-in-yield-curve-about-future-recessions/).
[3] The data come from the Federal Reserve’s H.15 release: https://www.federalreserve.gov/releases/h15/.
[4] See the reference in the second footnote.
[5] The yield curve during the late 1980s episode was inverted for multiple days using either the secondary market or the constant maturity 3-month Bill rate. The yield curve during the late 1990s episode was inverted for multiple days only using the constant maturity 3-month Bill rate.
[6] For what it’s worth, a Chow test indicates that the regression coefficients are not different with 95% confidence when the recent observation is added to the regression sample.
[7] The data for the output gap were released with An Update to the Budget and Economic Outlook: 2019 to 2029, August 2019 (https://www.cbo.gov/publication/55551).
[8] The term spread is shown on a monthly basis and CBO’s estimate of the output gap on a quarterly basis.
This post written by Kim Kowalewski.
really interesting. thanks heaps for this
I have mixed feelings about the conclusions of this post. Not that I don’t think the data chosen isn’t good or applicable. And not that I think the data has been misinterpreted. But I do kinda feel there is a component of this recent yield curve inversion that is less….. “alarm bells ringing” than other inversions. I have stated that I think we will have a recession before late July 2020. My level of confidence in this prediction partly hinges on donald trump not delaying the December tariffs, although I am predicting the recession either way. I think because of other data and the feeling that something in the shadow banking, derivatives sector, or equities will create some problem by the July 31 deadline. If we get past that time, I will do my little mea culpa and wave the white flag. I should actually be happy or celebrating this post as it would bolster or at least rhetorically support my argument. But I am not going to be a phony and say I think the yield curve is what makes me feel confident in that recession prognostication as that is only a peripheral support of other factors which I view as the prime or pivotal factors.
Nobody likes to be wrong, and I will take a dent to my ego if I’m wrong, but I guess if I’m wrong by July it’s good for people struggling out there, so I will be semi-happy to be wrong here.
Is it a sign of some kind of sick narcissism if I reply to myself?? Don’t answer that.
I have heard many say that this actual trade war will only skim off a tiny part of the GDP off. This is probably true, but we know it’s not going to help—it keeps a negative snowball rolling, especially with multiple other negative factors present. Mary Lovely has a post up today, but it was in essence just working off the numbers she and Yang Liang had already crunched out in a November 7 blog post. If you’re lazy like I am the visual presentations of Figure 1 and Figure 2 are quite nice to help with conceptualization of the broad picture, they are a little over 1/2 way down of the article if you scroll down, and are presented mostly in bar charts.
https://www.piie.com/blogs/trade-and-investment-policy-watch/they-saved-worst-last-why-trumps-impending-december-tariffs
I put only a 33% chance that donald trump actually enacts and enforces these December tariffs. I think he will announce it as another delay and frame it in terms of his own “benevolence” towards the Chinese. That being said, Ana Swanson’s Monday article in the NYT seemed to paint the picture that White House staff believes trump will stick to his guns on the tariffs.
IOER – 2..35%. Previous yield-curve inversions have been against a constant IOER = 0%
@ Bob Flood
The IOER is a very interesting topic of you to bring up. The Federal Reserve was talking about this back in April-May time period. I think they already saw there was going to be a funding problem. I think the Fed also probably already knew “emergency” Repo funding was in the cards and on its way. Not only are they using IOER to keep short rates lower, and as a “policy tool” in semi-desperate times for finding tools to use when near the ZLB, but also as an attempt to delay the Repo sales (some Repos needed mid-month and not end of month, which again shows it’s a funding problem, not just a liquidity problem). The Federal Reserve leadership knew the Repos would cause a “political optics” problem, and be viewed by some as a kind of “QE”, and also a not very subtle way to avoid the appearance of placating donald trump on lowering the fed funds rate. So I think IOER was both a way to delay Repos sales (which the Fed could see were eminent) and inhibit short term rate rises.
Another more subtle topic I am wondering, is how much dollar demand from outside the USA (European banks for example, others) for different transactions which necessitate the usage of the US dollar are also causing the high demand for funds and part of the need for “emergency” Repos which are now becoming more permanent.
If anyone has thoughts that either correct what I have stated or could further edify me, I would genuinely love to hear them.
Bob,
Thanks for again bringing up IOER as you did earlier. I am a bit surprised that Menzie did not mention it as one among several other things that are different now than during past inversion episodes. We have had a number of substantial changes in both how the private banking and financial systems operate as well as regarding policy, where how central banks, not just the Fed, manage their policies. My guess is that Menzie did not go through all these because it is far from clear exactly how IOER > 0 and some of the other policy changes out there influence relations between long term and short term rates, which is what inversion is about, although some of them may well influence these things. I guess one can argue that with IOER putting a floor above zero on short-term rates that might increase the probability of having an inversion episode when various forces push long term rates down as argued by Janet Yellen.
Something quite distinct from all this is the question of the repo ruckus in mid-September and nonsense claims about supposed long term “funding” as opposed to short term liquiidity needs. What is absolutely not the case is that somehow back in Apil-May or whenver the Fed was discusssin this and worrying about disruptions of the repo markets in September. It is asserted that “the Fed also probably knew ’emergency’ Repo funding was in the cards and on the way.” Good thing “probably” is in there, as there is zero evidence they knew this or foresaw this. All the evidence is that the Fed was taken by surprise as pretty much everybody else when this disruption appeared in mid-September, and it remains that it is not generally agreed upon why it did, although the theory touted by some that this was the Basel III Accords capital requirements on large banks that hit unexpectedly is consistent with the apparent data.
As it is, those Basel requirements only took effect in the US in March 2018 and are simply one among several other major changes out there in how the US banking and financial system operates. Like some others, I do not offhand see the Basel III Accords having much relevance to the yield inversion question, although I could be wrong about that.
Barkley Junior states the following:
Something quite distinct from all this is the question of the repo ruckus in mid-September and nonsense claims about supposed long term “funding” as opposed to short term liquiidity [sic] needs. What is absolutely not the case is that somehow back in Apil-May [sic] or whenver [sic] the Fed was discusssin [sic] this and worrying about disruptions of the repo markets in September. It is asserted that “the Fed also probably knew ’emergency’ Repo funding was in the cards and on the way.” Good thing “probably” is in there, as there is zero evidence they knew this or foresaw this.
Apparently, some people are not intelligent enough to decipher the timing of mid-month strongly implies it is not caused by minimum capital requirements of Basel III, but other issues related to commercial/investment bank behavior. The Repo Ruckus happened on September 16th and September 17th. Many of Menzie’s readers might find the dates on these Fed posts just below fascinating. I wonder why Federal Reserve posts on Federal Reserve hosted sites would discuss a long-term Standing Repo Facility back then??
https://www.stlouisfed.org/on-the-economy/2019/march/why-fed-create-standing-repo-facility
https://www.stlouisfed.org/on-the-economy/2019/april/fed-standing-repo-facility-follow-up
Lastly, why would the Federal Reserve lower the IOER rate to lower the incentive for parking funds with the central bank back in May around the same time as the discussion of a long-term Standing Repo Facility?? Does anyone think Powell and friends thought the IOER rate lowering was a long-term solution?? Or was it more likely a band-aid fix before they started the Standing Repo Facility?? I invite readers to use your brain and judge yourself.
Interesting, Moses. Did you actually read those two pieces by Andolfatto? The term “funding” never appears. There is lots of discussion of higher liquidity demands, especially in connection with “short term liquidity demands in tines of stress.” I am right; you are wrong.
In the first of those pieces Andolfatto mentions two changes that raised concerns especially larger banks in terms of wanting to have more reserves to meet these suddend spikes in need for liquidity “in times of stress” (of which the impending end of a quarter counts, although Andolfatto does not mention or foresee that in particular as such a time, although those have indeed long been known to be such a time), were “Basel III” and “Dodd-Frank.” Yes, there it is, as I reported, “Basel III” mentioned in this link you provided. Did you read that?
I would note that while Andolfatto called for one, no long term Repo facility has been set up, although instead reportedly the Fed is actively intervening in the Repo market to keep it stable.
Finally, you think somehow that the lowering of the IOER in May is connected to this. But this was the fifth such lowering, with them starting in late 2018, with all this obviously just part of the loering of interest rates that the Fed started doing after 2018. Sorry, nothing to this, not related at all to your fantasies and misrepresentations regarding this.
Another point on the Andolfatto pieces. While he calls for an additional Repo facility (still not created) in order to help provide reserves especially to the 8 largest banks facing pressures from Basel III and Dodd-Frank on their ability to meet short term liquidity needs “during times of stress,” he does not actually forecast turmoil in the existing Repo markets if nothing is done, although it is not unreasonable to say that this is consistent with his argument, implicit in it. But he does not actually make the forecast.
Oh, and somehow you are still under the delusion that emboldening words in comments convinces people of the reasonableness of your arguments rather than convincing them you are pounding on a table and shouting like somebody on Fox News talking about the impeachment hearings because at some level you know and they know that you know that your argument is weak (which it most certainly is in this case).
Sorry, boy, still have not caught me getting it wrong, :-).
Barkley Junior
You’re giving me a good laugh. Does the American Bankers Association have you on retainer??
Moses,
You need to read carefully the links you provided by David Andolfatto. If I am on a retainer from the ABA, so is he.
Another curious aspect of his post from the perspective of now, two months after the repo ruckus, which he actually did not forecast, despite calling for an additional repo facility, is that the problem he described of insufficient reserves for the largest banks facing Basel III and Dodd-Frank, is that he made no comment on the ;policy then in play by the Fed of gradually reducing its balance sheet, something being done slowly and in the background, supposedly so as not to disrupt markets. As it is, when the repo ruckus hit the main thing that happened besides the NY Fed directly intervening in the repo markets to stabilize them was that they halted the drawdown of the Fed balance sheet. That stopped dead cold, and indeed if anything has been slightly reversed since with renewed small increases.
As it is, given that Andolfatto was accurately aware that the big banks were facing future threats to their ability to raise liquidity “during times of stress,” which was exactly what happened ijn the repo ruckus, it is a bit surprising that he did not mention or note that this drawdown of Fed balances was steadily increasing the chance of exactly such a problem during a time of stress. Instead of setting up this new facilkity, which has not been done, he could have called for a cessation of this drawdown, which is indeed what happened when the ruckus hit. But I think he was in with the consensus of “trying to get back to normal” with lower Fed balances and interest rates more like they were prior to 2008 and all that, so was on board with this gradual drawdown. Indeed, there was pretty much near unanimity on this.
So it is a bit ironic that the main person at the Fed, a prominent new monetary economist associated with the St. Louis Fed research shop, who was aware that there was a potential liquidity problem for large US banks as a result of such changes as the adoption of Basel III capital requirements, did not pinpoint the main Fed policy that was dragging the system towards experiencing such a liquidity crunch and call for either its cessation or reversal, indeed, made no mentino of the policiy whatsoever.
To reiterate a bottom line I stated earlier: the Fed and pretty much all the banking system was caught off-guard by the repo ruckus. It came out of the blue essentially. Yes, there was at least one analyst, David Andolfatto, and maybe a few othewrs such as Randal Quarles, who were aware that at least the large banks were facing heightened dangers of facing a liquidity crunch in “times of stress.” But none of them called for a slowing of the drawdown of reserves by the Fed that was gradually pushing the system to the crunch point. When it came, it was a surprise, although there were many who were able to provide an explanation as there had been discussion of the general possibility earlier.
Very compelling, understandable and clear.
Are there any “on the other hand arguments” you could share, other than your work not being “definitive” as you mentioned?
Dear AS,
I’ll give you one. Look at the graph “Inversions of the 10-Year/3-Month Spread”. Leave out the 1612-1908 point. You will find a quadratic works better than the linear regression used, and that 1612-1908 is a little higher above the quadratic than it is above the linear. Such a curve will fit the 0405-0703 point better than the linear one does and explain more. The difference will not be statistically significant, but it will be noticeable.
Julian
Hi Julian,
I crunched the data and see what you are saying, but I guess I am a bit slow. Does the relationship need to be linear to validate the thesis of the inversion being “not different” this time?
Dear AS,
You’re not slow. Far from it. To me, it is just a different way of looking at things, and this particular thing is a limited dependent variable in my view. As we see with Barkley Rosser and Moses Herzog, or would, people’s intuitions work in different ways. To have a signal, which the inversion is, show the probability of a recession would seem to me to make it a linear probability model, and as an old student (in every sense) of the late Professor Dhrymes, there are very few cases where such a model would seem to me to be the best choice to model limited dependent variables. For anyone else who might venture in, the online reference of
https://www.birmingham.ac.uk/Documents/college-social-sciences/business/economics/kit-baum-workshops/Bham13P4slides.pdf
seems reasonable as just a basic introduction to the whole issue.
Julian,
Thanks for the response. I will review the links you provided.
No worries about me getting “mad” from your response. I appreciate the education.
Julian,
Quite the volume of introduction. Will be interesting to read.
Thanks
P.S. Let me just add a little bit to this. For political reasons, what John Kenneth Galbraith called “the liberal hour”, and the spending that can be expected with it, I remain very skeptical of a recession in 2020. Slowdown, yes, recession, no. Circumstances are completely different, but this looks more like the 1987-1991 experience to me. And yes, of course, this could be completely wrong as usual. The designations Kim Kowaleski is using would seem to make the current state most like that, and the result took a while.
P.P.S. Before people besides AS get mad at me for not being clear and not providing a model, which I admit I should have done, see the Cleveland Federal Reserve Bank’s analysis, which does what I really have in mind, at
https://www.clevelandfed.org/en/our-research/indicators-and-data/yield-curve-and-gdp-growth.aspx
The 1980s and the present look similar there, and the present is a little worse. But their latest figures show the probability coming down.
There is a fair amount of similarity to the early 2000s, also.
Thank you very much. Having been criticized in print, I greatly appreciate any consideration.
Let me add something completely cynical. The stuff I am familiar with is 1980s-1990s vintage ideas of trying to use various functional forms that went back to some sort of explanation in economic terms. The classic case is GARCH models. When they first came out, they multiplied like rabbits, and there were limited interpretations available. (A by no means complete list includes ARCH, ARMA-ARCH, GARCH, EGARCH, IGARCH, and GARCH-M.) Interpretations have gradually caught up. For example, IGARCH seems to show up as a proxy for structural change. A nice, relatively recent presentation of this, which has one subtly bad example for Menzie to use, is in
http://www.business.uwm.edu/gdrive/Haas_T/busadm713/dicky-igarch.pdf
But you could always go back to the economics, with some difficulty. Now, employers want data analysis for everything. So there will eventually be a machine learning version of what inversions signal recessions, and it will take some time before the interpretations catch up with them. Those who want to be employed will become data analysts, and the straight economists will have a difficult time. The conclusion to the reference above is precisely right:
“This example serves to illustrate several important points. One is that careful checking of model implications against what happens in the data is a crucial component of proper analysis. This would typically involve some graphics. Another is that failure to meet assumptions is sometimes not so important but at other times can render estimates meaningless. Careful thinking and a knowledge of statistical principles is crucial here.The naive use of statistical methods without understanding the underlying assumption and limitations can lead to ridiculous claims. Computational software is not a replacement for knowledge.”
Today Forecasting the year out performance
Of real output market systems
Is like turning
lead into gold
using 16th century technology
However
Preparing the macro management response to
Signifigant output contractions
Has great potential returns
Now the fed first and foremost
macro strategy
Dominant for the last 35 plus years
Is at very low capability
Let’s investigate rapid response fiscal mechanisms
“When the output gap is positive
….actual output is greater
than potential output”
To a regular user of English this is nonsense
“Potential output ”
That’s one of the many new speak labels
We use to fuzz up macro management
Like steady prices
And
full employment
As a self appointed social philosopher
This resort to
verbal inversions
Displacements
And other semantic smoke bombs
Signals
cognitive breakdown ahead
Bernie never used U.S. State Department policy as his personal campaign treasure chest. Were those donations “Quid Pro Quo”?? What do the facts tell us??
https://www.opensecrets.org/news/2019/11/clinton-foundation-cash-flow-drop/
No, apparently it wasn’t Hillary’s sunny disposition or truthfulness that got Hillary all that money. But really, who knew??
I am a BernieBro. I am also an Acasio-Cortez fan, and a Tulsi Gabbard fan. And many others. A near cavalcade. It cannot be denied: I yam what I yam.
https://www.youtube.com/watch?v=qhxDQ1g964U
Bravo
I appreciate it.
No, “Bernie” leeched off of society and college kids as his personal treasure chest. Supporting a zionists and Republican like Gabbard cracks me up. She is outright supported by jewish oligarchs in Eurasia and why she squeals about the Democratic party is stupid ways, like should give you warning. Why do you think the mobster state media in Russia constantly give her “room to breath????”……
I’ve always thought Thomas Friedman was over-rated. I remember watching him when I was a child on Washington Week on Friday nights, back in the day when Charley McDowell was a regular panelist (the most humorous guy that show EVER had). My father watched that show religiously during those years, along with Louis Rukeyser. Probably would have been very early 1980s. But as much as I kinda roll my eyes at Friedman’s celebrity status on the left, I have to say, I LOVE this column title:
https://www.nytimes.com/2019/11/18/opinion/mike-pompeo.html
Thomas Friedman’s was well said. But note he is only repeating what others have said about the overblown coward we have as Sec. of State. Sondland’s testimony today throw that fatso Sec. of State under the bus.
Found over on FT Alphaville. Folks, in these seemingly dark times, we have to find the humor that we can in very dark topics. That humor can get us past those dark times (possibly with an adult beverage or two, or three, or four or……. mixed in)
https://twitter.com/MrMichaelSpicer/status/1196945494494371840
If SNL doesn’t have fun with this one (maybe Ferrell cast in the lead wearing some kind of awful gray mat on his head) then they should just shutdown for business.
Sondlond’s opening remarks:
https://talkingpointsmemo.com/news/sondland-opening-statement-impeachment
Quid pro quo – Trump knew. Pompeo knew. I guess this is why Nunes opening remarks were so disgustingly dishonest and hostile. Expect the Trump sycophants to go bananas for days!
Something disturbing is that it seems that to the extent the polls are moving, which is not a whole lot, at least on impeachment they have been moving ever so slightly towards Trump since the hearings began. I find this very depressing, although my Russian-born wife, fresh back from Moscow, has been forecasting this loudly all along.
Of course our pal Moses has been slamming Pelosi as “senile” for not having pushed the impeachment hearings even sooner when there was less strong evidence out there for it. But then, maybe he is spouting the line of homophobic Putin troll Gabbard on this matter.
@ Barkley Junior
You say “less strong evidence”. That’s a fascinating view by you. So your assumption appears to be that the whistleblower would have been less likely to step forward had the impeachment proceedings started earlier. And your statement also assumes if documentary evidence and White House and State Department records we can’t see now which would have been released much quicker under an earlier starting date for the impeachment inquiry, that this delay in evidence is “helpful”. That’s the near equivalent (actually worse) of saying reading only the beginning part of a research paper and skipping the latter part which says the Native American ancestry is uniformly distributed among European Americans is “helpful” to learning.
Starting the impeachment inquiry earlier would have also released parts of the Mueller Report that were withheld much earlier. You also think it’s “helpful” to have only part of this evidence?? Interesting take from the PhD. But I think having more data and evidence is always better than looking at only the portion a person may find convenient to their own stance. I’m strange that way Barkley—and I know it bothers you.
In his closing remarks, ol’ Shifty Schiff shifted into a higher gear than the Repubs could hope to match. A checkered flag was unnecessary as he finished his comments.
He made the dimwit Nunes look like he was struggling to pedal a two wheeler with sagging tires and a rusted chain.
I was mildly surprised at how fervent and intense Representative Schiff got. Even going so far as to say he wanted to use the F-bomb were it not for sullying the proceedings. And the way he said “silent” kinda grabbed me. This is why I like politicians like Gabbard, Ocasio-Cortez, Bernie etc (and there are others). They’re not standing there like Joe Biden, Cory Booker, and Hillary thinking that when Americans are suffering the proper response is to get a wry smirk on your face and then tell everyone how much you think Dick Cheney is a “decent man”. That’s not how Republicans like Jim Jordan play the game, so why do we (Democrats) keep playing slumber-party pillow fight while Republicans play gorilla warfare racquetball. Frankly I hope Representative Schiff (while keeping it tethered to rationality) “unleashes” this part of himself a little bit more.
This came out within the last two weeks, and I think it’s a worthy read. I would even argue it’s more informative than the Federal Reserve minutes release.
The download link is in the upper right after your link jump—->> https://www.federalreserve.gov/publications/2019-november-financial-stability-report-purpose.htm
It appears there were two members who had more reservations about the rate cute. I’m very curious to know which two those were, I suspect one of them was Miss Brainard.
Oh yikes! Moses, you are reverting to all of your worst behaviors. Not only are you lying about the uniform distribution matter that keep bringing up, but you are back to referreing to married Fed govenor with a PhD as “Miss,” one you even claim to admire. No wonder you could not get a prom date. Even your redneck pals fromyour youth have probably figured out that somebody like her should probably be addressed in descending order of acceptability as “Governor” or “Dr.” or “Ms.” or “Mrs.” but not remotely as “Miss,” which is both inaccurate and insulting.
What is the matter with you, Moses? have you gone completely off the deep end?
So, the economy and the inversion. We are currently seeing positive signs. I don’t think that means much more than there are positive signs and negative signs when the economy is choppy. It’s been choppy for about a year, maybe more. This time is not different.
Moses,
Starting impeachment sooner without knowing about this Ukrainian bribery scam by Trump would have been much weaker and would have gotten no more evidence out than we have now, and we would not even be trying to get out some evidence that we now know is important that is being held about this Ukrainian matter. The grounds would be on either emoluments or obstructiion of justice based on the Mueller Report. I take emoluments seriously, but it is a complicated matter that Trump and his allies could throw much more publicity sand than on the bribery charge. And as apparently you seem not to have noticed, the Mueller Report ended up being a publicity dud. Yes, much of that was due to Barr lying and misleading, but if you think using it as the basis of an impeachment hearing, you are mistaken. It would have tanked such a hearing pretty much upfront.
And then we have you insanely bringing up at this point, with bolded words, a completely false claim. Quite aside from the fact that it is simply false that Native American ancestry is evenly distributed across the European American population. But here you are claiming that such a false claim actually appears somewhere late in a paper much discussed here. This is a lie, Moses, and you need to retract it. It is not there. This is as big of a lie as your false claim that there was no poll showing Warren and Harris ahead of Biden in Iowa at one point. You are lying, and you should stop it, and you should apologize for doing it, and repeatedly doing it.
Have you just completely lost your worthless mind, Moses? Stop lying, you creepy scumbag. This has really become completely unacceptable.
Liar liar, liar!
I must confess I do not understand this debate. It seems clear from my cursory examination of the paper — https://www.ncbi.nlm.nih.gov/pmc/articles/PMC4289685/ — that if one randomly pick people from the self-identified European-originated population, you will get a distribution of persons with varying levels of Native Amerian ancestry as defined by genetic material that is *not* like a uniform distribution. In this sense, some people will have quite high levels, and some quite low. And I thought that is what Rosser was trying to say. The term “skewed” is then used in a colloquial sense, not a strictly statistical sense (although that might be true if there is a thick tail, something that does show up in the paper).
There is a separate issue of distribution of DNA material across the genome; my reading is that this refers to the physical location of the segments on the genome.
Menzie,
Thanks. I am sorry that we seem to have to keep revisiting this silly stuff. As it is the article never says either that the distribution of Native American ancestry across the Euro Americans is either “uniform” as Moses insists the paper actually says, nor does it specifically say that the distribution is “skewed.” As it is, I happen to know from a lot of evidence that in fact that distribution is skewed in the proper statistical sense, and I argued that one can see that from a careful reading of the paper. I made those arguments a long time ago and see no point in repeating those arguments. However, you are right, Menzie, it is just plain obvious that distribution is nowhere near being “uniformly distributed.” This is just rank nonsense.
The more serious point is that for whatever reason, Moses keeps bringing this up and is now engaging in an outright lie. The paper simply nowhere makes the statement that Moses has here claimed it does. I got tough on this and said he is lying, and frankly that is what it is. I do not know if he will admit he is wrong about this completely false statement. But that is a fact. If in fact he does admit that the paper simply does not say what he says it does, I doubt that he will apologize, based on the history of the case when he inaccurately claimed that I was lying about that poll in Iowa. He did eventually after a lot of huffing and pugging admit he was wrong, but he never has apologized.
In any case, Moses, even if you are unwilling to even admit that you have been making a screamingly false statement about the contents of this paper, much less apologize for lying, maybe it is finally time for you to simply shut the eff up once and for all about this matter where you have done nothing but humiliate yourself over and over. It really is time to stop it.
Maybe researchers meant uniformly distributed in “the colloquial sense” when they specifically stated it in the paper?? I do not know how you would read that. From bottom of page 49 to the top of page 50 (of the journal page numbering).
“Another line of evidence supporting our estimates of non-European ancestry in European Americans in the US is that we observe a substantially lower occurrence of Native American and African ancestry in individuals who self-report four grandparents born in the same European country. The inferred segments of African and Native American are uniformly distributed across the genome. Although we expect that some of the inferred ancestry might arise from difficulties in assigning ancestry in complex regions of the genome, only a small fraction of the estimated African and Native American ancestry in European Americans can be explained through such biases and is not expected to give rise to any substantial (more than 1%) ancestry from any population.”
If you look at Figure 3 on page 45 (again of the journal’s numbering), I think the appropriate part of Figure 3 to look at would be the one designated with the Letter B. Do you see the variations in percentages they use in the European Americans with Native American ancestry group?? The highest number they choose to segment/differentiate the data with is 4%. If you think that is “skewed” which is the word Barkley Rosser was using to describe the numbers of the research paper then I guess your depth of perception is much deeper than mine. I’d like to see that presented in a histogram with each group in respective bars (by state, whatever) where you have one group in the 2% and another group in the 5% group and see how “skewed” that looks. Would it be a straight line?? Obviously not, but I bet it looks more uniform than “skewed”.
You would call a person with say 2% Native American and another with 5% as “skewed” data?? Because that’s what we’re talking about here—a random sample from European Americans. The whole reason this argument started was Barkley refusing to admit he was wrong about Elizabeth Warren after her DNA test came out which most people thought put her under 2%. She lives in Oklahoma, a state with higher numbers than average for Native American ancestry, and Elizabeth Warren can’t even meet THAT standard. And she apologized. Why did Elizabeth Warren apologize?? Maybe when Warren apologized to Native Americans for her claim her thinking was “skewed”?? As that label now seems to work in describing data in a statistical research paper “in the colloquial sense”, why not for Senator Warren??
Moses Herzog: I haven’t taken biology (evolutionary biology from E.O. Wilson) in a long time — but the distribution is *over the genome*…
@ Menzie
Sir, all of the following is stated with the utmost respect for your intelligence and achievements, and none of that will change based on the answer you give to the following question: Are you saying the sample data of Native American ancestry in European Americans from the paper Barkley originally cited is “skewed” like Barkley is saying, indeed, Barkley has said multiple times?? If you’re willing to stand on that hill that Native American ancestry is “skewed” in European Americans , this’ll be the last comment/post you see from me on the topic. The VERY last comment I make on it, if you want to stand on that “skewed” hill. You can’t say you haven’t fantasized about my last comment on this topic. It’s yours for the taking. Like your favorite candy bar at the grocery checkout line, it’s right there for you to grab.
Sigh…
I am sorry, Menzie, that you have been dragged as so many of us have to this absurd point, with several others also noting that “A genome is not a population.” That is the bottom line. I am not going to provide further any explanation why indeed the distribution over the population is skewed. I have done so many times here previously, but no effort has sunk in to Moses, and somehow Moses continues to believe that this passage says what he thinks it does. But it does not. A genome is not a population. Period.
Really, Moses, how many times do you have to have it verified here that you are just plain wrong on this? The bottom line is that this passage does not say that the distribution over the population is uniformly distributed, and no other passage comes even this close. You are and have been lying about this matter.
You owe everybody an apology for lyhing, Moses, not to mention wasting our time, and now you especially owe Menzie an apology as well as you especially owe one to me.
I have commented on the specific issue many times previously and said I would not waste peoples’ time doing so again. I understand it is impossible to get it through Moses’s thick head, but maybe I need to state this to convince Menzie, even though other readers here who know about this stuff get it. And, weirdly enough, it seems that Moses’s obsession seems to be tied to his “woman problem,” in this case his vendetta against Elizabeth Warren.
So, in a uniform distribution, and some others such as a Gaussian normal, the mean equals the median, the latter the indiividual at the 5oth percentile, the “representative person.” However, for skewed distributions that are asymmetric, such as income and wealth distributions over populations, the mean is greater than the median. This is the case for the distribution of Native American ancestry over the European American population, very much so.
There are several sources for what I am about to say, but a couple of them are listed in the Wikipedia entry on “Native American ancestry.” So, the mean for such ancestry over the Euro-American population is about 0.18 percent. This got Moses all excited because that of Warren seems to be probably either that number or half it, .009 percent. Wow! Less than “the average American” he ignorantly proclaimed.
However, the median is zero, very much so. only 2.3 percent of European Americans have any Native American Ancestry, meaning that 97.8 percent have zero. Not only is the median zero, it is nowhere not being zero. Warren has more Native American ancestry than upwards of 98 percent of the European American population, probably above that. He could not have been more misleading in his idiotic claim about Warren.
So indeed, this is a very skewed distribution, with the vast majority having zero, but the mean being pushed up by small numbers of people with quite high percentages of such ancestry, although it gets fuzzy exactly where that boundary is, so this is noisy data. But claiming that Warren had less Native American ancestry than “the average American” was wildly wrong and stupid, and his ongoing efforts to justify his ignorance by lying about what that particular article says, somehow trying to believe that “a genome is a population” has gone far beyond pathetic into the obsessively insane and morally disgusting.
Apoogize, worthless liar!
PS: I suspect that the percentage of European Americans with N.A. ancestry is higher than 2.3 percent. Heck, it might even exceed 10 or even 20 percent. But it is nowhere near the 50 percent it would need to be to get that median different from zero.
And that is all I am going to say ever again here about the substance of this issue, although ff Moses continues to claim that a genome is a population, I shall again remind everybody that this is just a lie, quite aside from completely stupid.
@ Menzie
Menzie, I am much much more verbose online than I am “IRL” (as the kiddies say). You would be shocked. Nonetheless, it’s not everyday I offer someone an opportunity to shut me “TFU” (??). Even if it is only on this single topic. This is like Miss Piggy telling “Kermie” she isn’t going to hit on him anymore. This offer only applies to you, but I can tell you, if I gave this chance to Barkley Rosser to shut me up on this topic, he would take it. It only would take 2-3 sentences. Don’t torture Barkley like this.
P.S. I will even extend this offer to any professor currently employed at U-W Madison teaching in the appropriate sciences/statistics background to tell me the data pertaining to our argument in that paper is statistically skewed. If you can recruit ANY professors matching those parameters to tell me the data is skewed, I will accept this ALSO and the topic will then be dead on my end of it.
You have your answer, Moses. Nobody at UW-Madison is going to waste time on your idiotic request.
Instead, Menzie has posted on how using the skewed-student distribution fits macro business cycle data than Gaussian normal, with your reaction to rush in to fall flat on your face exhibiting your massive ignorance of these matters. This is all over for you, boy.