May CPI inflation surprised on the upside, with month-on-month 0.6% vs 0.4% (not annualized) Bloomberg consensus, year-on-year 5% vs 4.7%. Note that May’s 0.6% month-on-month is below April’s 0.8%, highlighting the decline in high-frequency inflation. We have the following readings on inflation (month-on-month):
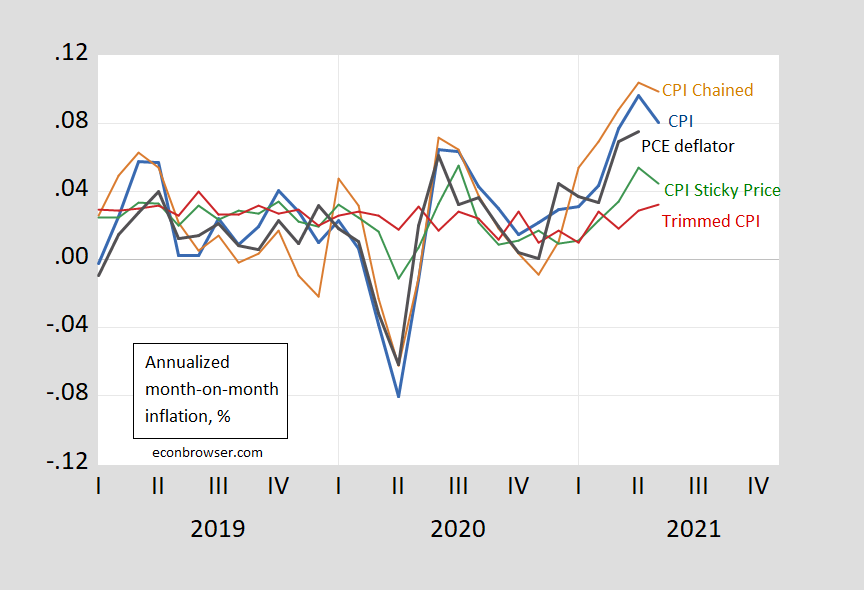
Figure 1: Month-on-month annualized inflation from CPI-all urban (blue), from personal consumption expenditure (PCE) deflator (black), chained CPI (brown), sticky price CPI (green), and 16% trimmed mean CPI (red). Source: BLS, Atlanta Fed, Cleveland Fed, via FRED, and author’s calculations.
Note that month-on-month inflation is down using chained CPI, as well as the sticky price CPI. The latter should represent inflation expectations better. The trimmed CPI — which takes out outliers in component inflation — did rise from 2.9% to 3.2%, so there are clearly some upward price pressures remaining.
If one calculates the longer horizon inflation rates, one can see the base effect. Annual CPI inflation is 5%, while 15 month (annualized) inflation is only 3%
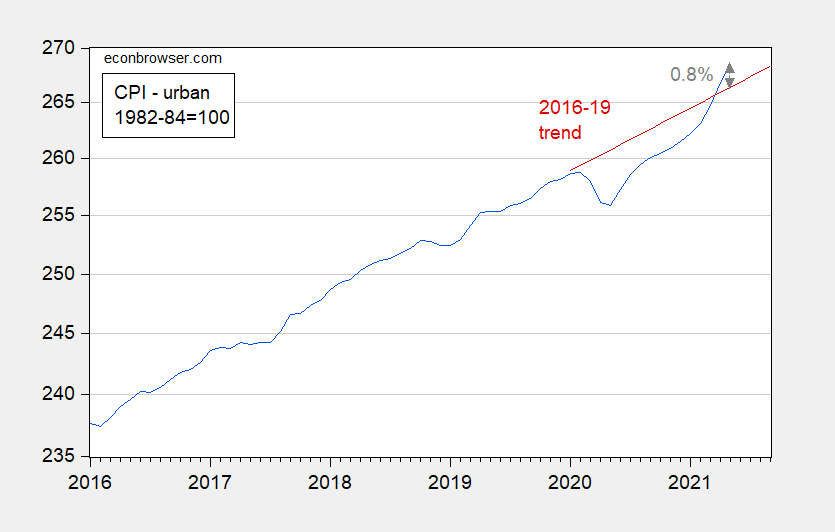
Finally, the base effect shows up to the extent that the actual price level in May is less than one percentage point above the 2016-19 (log) trend, despite the rapid inflation in the last two month’s of data.
Figure 2: CPI (blue) and 2016-19 trend (red). Source: BLS, and author’s calculations.
The market’s 10 year breakeven rate barely budged in the wake of the release, and remains near lows 0f 2.35% (and keep in mind, the breakevens are probably overestimates of actual inflation estimates by the market, as discussed here). The long term expected inflation is key to thinking about prospects for sustained inflation (see here for a discussion of inflation in the context of the Phillips curve).


‘May CPI inflation surprised on the upside, with month-on-month 0.6% vs 0.4% (not annualized) Bloomberg consensus, year-on-year 5% vs 4.7%.’
I earlier linked to some musings from Kevin Drum which tried to make a point but got confused. From May 2020 to May 2021, CPI-U did rise by 4.93%.
But take the 15 months from Feb. 2020 to May 2021 and the increase over that time period was only 3.75%. Annualized we get 3%.
Remember CPI-U fell during the first 3 months of this pandemic.
Biden at the G7 meetings told the world that the US will give other nations 500 million doses of COVID-19 vaccines. Now maybe we should be doubling that but I bet we will not hear a peak of this news from ltr.
pgl,
Now now, this will still leave US several hundred million in doses given behind the PRC. Of course the Sinopharm appears to be about 50% effective whereas the US;s Pfizer and Moderna look to be over 90% effective, although if we send out Johnson and Johnson it is somewhat less than that, although I think still well ahead of Sinopharm.
Important information that ltr refuses to acknowledge. Look – this should be a worldwide effort with international cooperation, which is why ltr’s spin that China is doing it best is so incredibly pathetic.
Would you rather get the vaccine that is 50% effective and readily available or the gold plated one that you can’t get because of U.S. patent restrictions?
And keep in mind that’s 50% effective for any symptoms but nearly 100% effective at preventing hospitalization and death.
Also worth noting that China is vaccinating 20 million per day. The U.S. is barely managing 1 million per day.
China has 4 times the population and none of them wear MAGA hats. What is the percentage of each nation of the people vaccinated so far.
During the 2016-2019 period used to construct that trend line, the core PCE deflator rose at less than 2% for most of the period. Which is to say , even though headline CPI has at last and only briefly climbed above that trend line, the line may represent something less than the Fed’s actual long-term goal. Either way, a good bit more inflation is needed to balance ealier inflation weakness, as shown in your figure.
md,
Why is there any need to “balance earlier inflation weakness”?
I assume macroduck means to get a 2% or slightly above 2% trend line.
Maybe we do not but a year of inflation > 2% is not the end of the world.
“macroduck” equals Big Quack.
if your longer term goal is to average 2% inflation, and the recent past has been under that level, not sure how you can achieve that level on average over time without a future period exceeding that level?
“Note that May’s 0.6% month-on-month is below April’s 0.8%”
OMG! Inflation is decelerating!
If you remove used cars from core inflation over the last 15 months, annualized inflation is just 1.8%, still below the Fed’s 2% target. Need more stimulus!
Surely we shouldn’t base fiscal and monetary policy on the price of 10-year-old Corollas.
For someone not in the car market, it is good to know that the price of beer is not rising that fast. But I have given up on bagels for now.
A very important observation. The current price increases are driven by used cars and airline tickets. Both are clearly temporary issues. To those who have predicted 20 of the last 2 cases of double digit inflation – I am afraid we shall soon see the deflation of your balloons.
Pretty clearly Biden needs to get cracking on ending the tariffs on certain goods that are inputs to production in the US, especially lumber, steel, and aluminum, sooner rather than later.
Yes. With all the fretting over not funding infrastructure investment, the last thing we need to do is increase the price of steel. After all the US steel sector is doing really well right now.
“After all the US steel
sector isexecutives and shareholders are doing really well right now.”Focused that for you.
https://www.nature.com/articles/d41586-021-01545-3
June 9, 2021
China is vaccinating a staggering 20 million people a day
Scientists are impressed by China’s juggernaut of a vaccination drive, through which it is currently administering nearly 60% of all COVID-19 vaccine doses globally.
By Smriti Mallapaty
For more than a week, an average of about 20 million people have been vaccinated against COVID-19 every day in China. At this rate, the nation would have fully vaccinated the entire UK population in little more than six days. China now accounts for more than half of the 35 million or so people around the world receiving a COVID-19 shot each day.
Zoltán Kis, a chemical engineer in the Future Vaccine Manufacturing Research Hub at Imperial College London, doesn’t know of “anything even close to those production scales” for a vaccine. “The manufacturing efforts required in China to reach this high production throughput are tremendous,” he says….
Of course, a reasonable metric in comparing China’s vaccination effort to that of other countries is the share of the population which has been fully vaccinated. China is not even in the top 20 nations in terms of full vaccination per hundred citizens: https://www.usnews.com/news/best-countries/articles/covid-19-vaccination-rates-by-country.
Most of the countries outperforming China don’t produce their own vaccines. China does. Heck, Mongolia is third in the world in getting it’s people vaccinated against Covid, and Mongolia is considerably poorer than China.
http://www.xinhuanet.com/english/2021-06/10/c_1310000659.htm
June 10, 2021
Over 824 mln COVID-19 vaccine doses administered across China
BEIJING — Over 824.8 million doses of COVID-19 vaccines had been administered across China as of Wednesday, the National Health Commission said Thursday.
[ Domestically, 7 Chinese vaccines are now being administered daily. Internationally, more than 350 million Chinese vaccine doses have been distributed to more than 75 nations. A number of countries will be producing Chinese vaccines. ]
https://news.cgtn.com/news/2021-06-10/Sinovac-vaccine-cuts-COVID-19-deaths-among-Uruguayans-by-95-study-10YHcdi0uTS/index.html
June 10, 2021
Sinovac vaccine cuts COVID-19 deaths among Uruguayan adults by 95%: study
The COVID-19 mortality rate among Uruguayans aged 18 to 69 who were vaccinated with Sinovac vaccine fell by more than 95 percent, according to the latest Vaccine Effectiveness report from the Public Health Ministry.
Two weeks after receiving the second dose of the CoronaVac vaccine, developed by Chinese drugmaker Sinovac Biotech, mortality fell by 95.3 percent among the vaccinated population aged 18 to 49 and by 95.2 percent among those aged 50 to 69, showed the report released Tuesday.
Meanwhile, CoronaVac reduced hospitalization in intensive care units by 94.4 percent among those under the age of 49 and by 92.2 percent among people aged 50 to 69….
https://news.cgtn.com/news/2021-05-30/Efficacy-of-Sinopharm-s-COVID-19-vaccines-proved-again-in-new-trials-10Gg3bcMVvW/index.html
May 30, 2021
China’s vaccine map: Efficacy of Sinopharm’s COVID-19 vaccines proved again in new trials
Two COVID-19 vaccines developed by China’s Sinopharm have shown an efficacy of over 72 percent in large scale phase-3 clinical trials, according to a study * published in The Journal of the American Medical Association (JAMA).
The two inactivated vaccines, developed by Sinopharm’s Wuhan Institute of Biological Products and Beijing Institute of Biological Products, showed an efficacy of 72.8 percent and 78.1 percent respectively against symptomatic COVID-19 cases, with rare serious adverse effects reported and it is the world’s first published phase-3 study results of inactivated COVID-19 vaccines….
* https://jamanetwork.com/journals/jama/fullarticle/2780562
OK, ltr, which vsccine is PRC handing out? I read “Sinopharm,” which has 50% efficacy in Seychelles. Now you post on “Sinovac” supposedly having a 95% efficacy in Uruguay. What is up here?
I am not interested in pushing one nation or another being more globally benevolent on dealing with the pandemic. Heck, if the US and PRc want to have a competition over who is saving the world more than the other from the current pandemic, well, that is great, and certainly much better than who has the most super impressive and scary weapons.
https://fred.stlouisfed.org/graph/?g=E1bH
January 15, 2018
Sticky Consumer Price Index less Shelter, 2020-2021
(Percent change)
https://fred.stlouisfed.org/graph/?g=w3Wk
January 15, 2018
Sticky Consumer Price Index and Sticky Consumer Price Index less Shelter, 2017-2021
(Percent change)
https://fred.stlouisfed.org/graph/?g=ECU6
January 15, 2020
Consumer Price Index and Food Prices, 2020-2021
(Percent change)
https://fred.stlouisfed.org/graph/?g=ECTY
January 15, 2020
Consumer Price Index and Energy Prices, 2020-2021
(Percent change)
I know I’m very late to the party but I want you to know that I really enjoyed this post. The graph with 5 inflation measures, the succinct and pithy discussion, the two paragraphs and graph about base effects, all *chef’s kiss*. Bravo!