From Goldman Sachs (A.Nathan, J.Grimberg) today:
Despite last week’s Q2 GDP release that showed growth contracting for a second consecutive quarter—tripping the rule of thumb that two quarters of negative growth constitute a recession—we don’t think the US is officially in recession. We note that the indicators that the NBER places the greatest weight on for determining monthly and quarterly business cycle peaks have all continued to increase, as gross domestic income rose in the first quarter and nonfarm payrolls have continued to grow at a rapid pace. And while labor market data has historically lagged other economic indicators, we find that it would be historically unusual for the labor market to appear as strong as it is at present even at the very outset of a recession. We see Q2 corporate financial results and management guidance as providing further evidence that the economic expansion continued during the second quarter, and also view the message from credit market fundamentals as reassuring. That said, growth has slowed substantially, and as a result we continue to expect the Fed to slow the pace of tightening from here, delivering a 50bp hike in September and 25bp hikes in November and December.
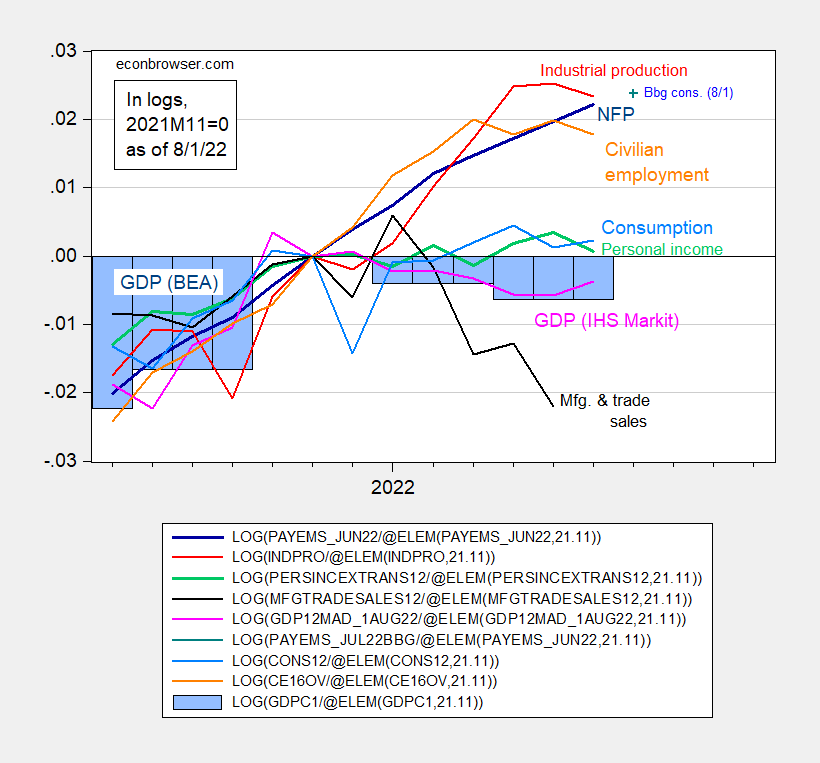
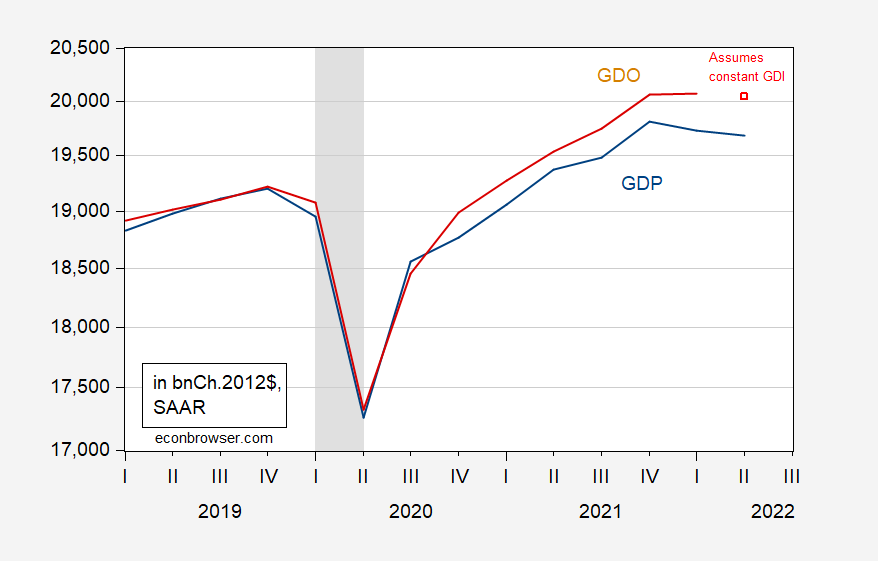
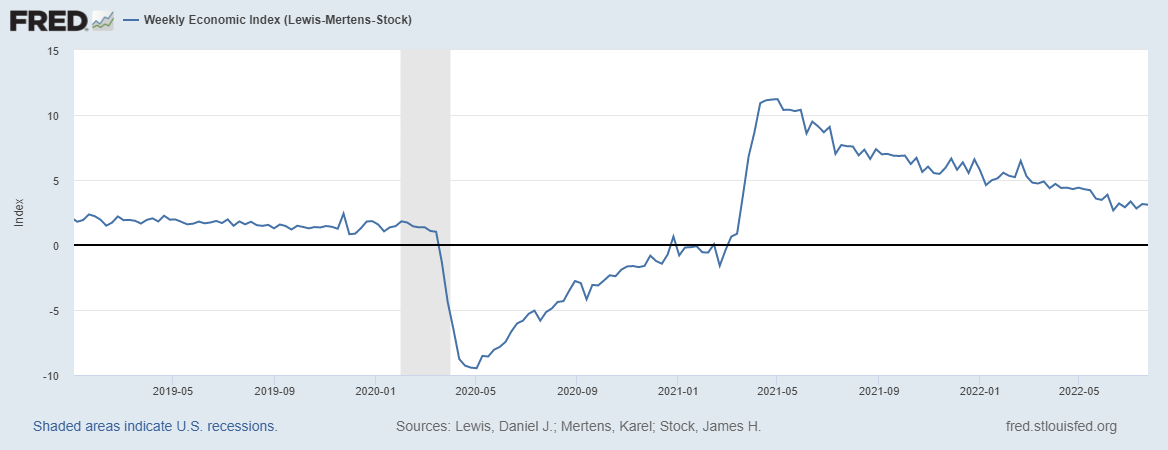
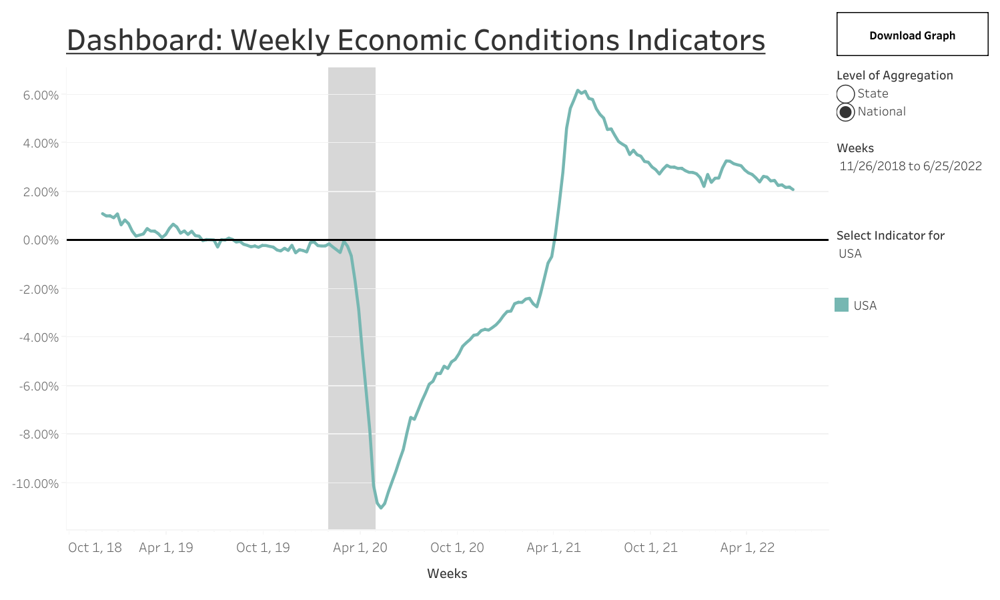
To recap, here’re key indicators followed by the NBER Business Cycle Dating Committee, plus IHS Markit monthy GDP (formerly Macroeconomic Advisers, series followed in previous BCDC documents) in Figure 1, GDP and GDO in Figure 2, and weekly frequency indicators in Figures 3 and 4.
Figure 1: Nonfarm payroll employment (dark blue), Bloomberg consensus as of 8/1 (blue +), civilian employment (orange), industrial production (red), personal income excluding transfers in Ch.2012$ (green), manufacturing and trade sales in Ch.2012$ (black), consumption in Ch.2012$ (light blue), and monthly GDP in Ch.2012$ (pink), official GDP (blue bars), all log normalized to 2021M11=0. Source: BLS, Federal Reserve, BEA, via FRED, IHS Markit (nee Macroeconomic Advisers) (8/1/2022 release), NBER, and author’s calculations.
Figure 2: GDP (blue), GDO (red), and GDO assuming real GDI constant in 2022Q2 (red square), all in bn. Ch.2012$ SAAR, on log scale. NBER defined peak-to-trough recession dates shaded gray. Source: BEA, NBER, and author’s calculations.
Figure 3: Lewis, Mertens and Stock Weekly Economic Index through July 23. Source: FRED
Figure 4: Baumeister et al. Weekly State Economic Conditions Indicator through June 25.
What to make of the argument that the US fell into recession in the January-April time frame? I remain (highly) dubious.


Princeton Steve has flip flopped on whether Goldman Sachs had a clue or not. When GS was not saying real GDP might dip slightly in Q2, he dismissed whether they knew what they were doing. But when GS indicated it might drip – Stevie called them the Gold Standard. Now GS sensibly writes:
We note that the indicators that the NBER places the greatest weight on for determining monthly and quarterly business cycle peaks have all continued to increase, as gross domestic income rose in the first quarter and nonfarm payrolls have continued to grow at a rapid pace.
Stevie will revert to his original claim about their abilities. After all – his views are very malleable.