NFP employment increase of 311K beat the Bloomberg consensus of 205K. This number confirms the continued strength in the economy overall, at least according to the key indicators followed by the NBER BCDC plus S&P Global (nee IHS Markit) monthly GDP.
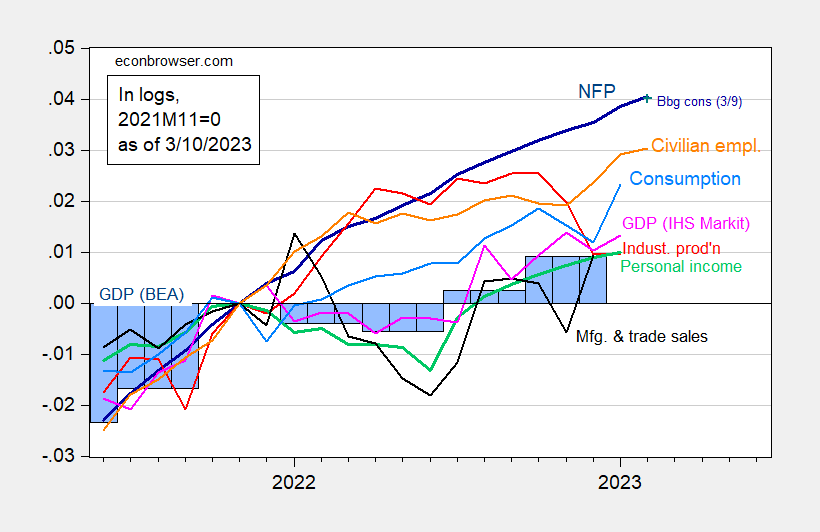
Figure 1: Nonfarm payroll employment, NFP (dark blue), Bloomberg consensus of 3/9 (blue +), civilian employment (orange), industrial production (red), personal income excluding transfers in Ch.2012$ (green), manufacturing and trade sales in Ch.2012$ (black), consumption in Ch.2012$ (light blue), and monthly GDP in Ch.2012$ (pink), GDP (blue bars), all log normalized to 2021M11=0. Q3 Source: BLS, Federal Reserve, BEA 2022Q4 2nd release via FRED, S&P Global/IHS Markit (nee Macroeconomic Advisers) (3/1/2023 release), and author’s calculations.
Given the debate over the strength of the labor market, particularly insofar as it relates to the 2022H1 figures, the following graph highlights the fact that if there was a slowdown in 2022H1 (particularly 2022Q2), it’s largely been reversed.
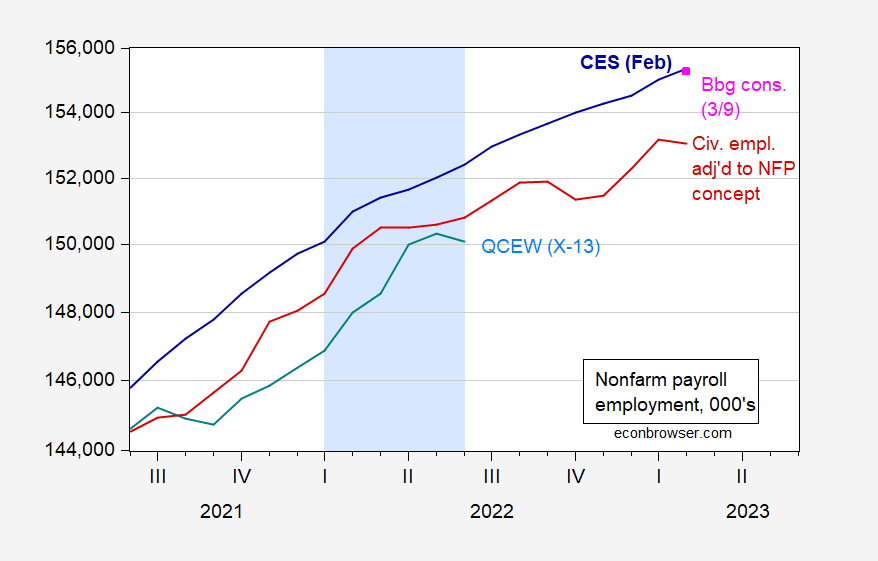
Figure 2: Nonfarm payroll employment from February 2023 CES release (blue), Bloomberg consensus as of 3/9 (red square), household series adjusted to NFP concept (red), QCEW total covered workers, seasonally adjusted using log transformed Census X-13 (teal), all in 000’s, s.a. Light blue shading denotes a hypothesized 2022H1 recession. Source: BLS, BLS QCEW, and author’s calculations.
While the employment increase was larger than expected, this was on downwardly revised December and January numbers summing to 55K; in other words, in terms of the level of employment, the 311K translates to 206K increase compared to 205K consensus increase.
Here’s another picture of the evolution of the labor market, from various perspectives — total NFP, aggregate hours from private NFP, civilian employment, and private NFP from ADP.
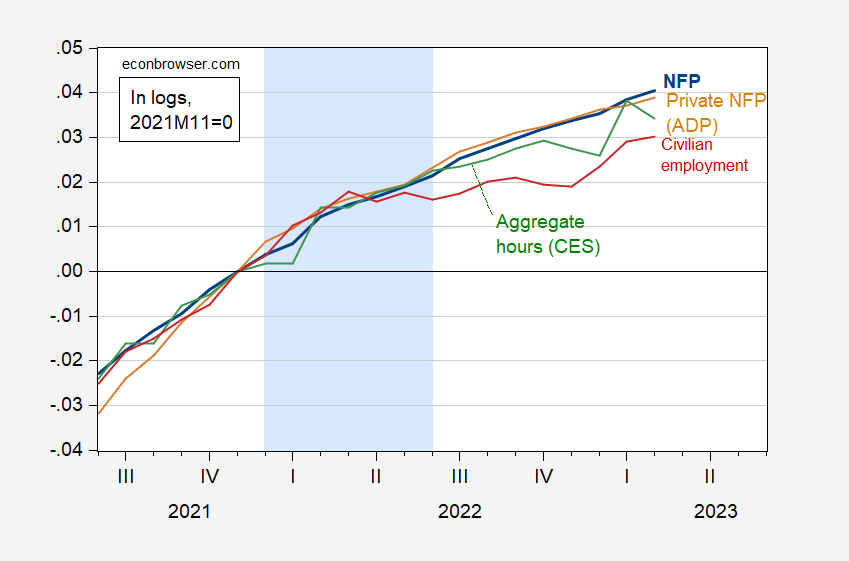
Figure 3: Nonfarm payroll employment from February 2023 CES release (blue), aggregate hours (green), Private NFP series from ADP (tan), civilian employment (red), all s.a., in logs 2021M11=0. Light blue shading denotes a hypothesized 2022H1 recession. Source: BLS and ADP via FRED, and author’s calculations.
@AS,
Nice job with the forecast. Looks like doing without a weather adjustment was a good idea.
[ The golf gallery adds hale and hearty, plus heavy and husky, nevermind huge and Herculean, applause ]
MD,
Thanks. March jobs could be much more difficult to forecast.
Probably around 150000. Though I expect unemployment to fall back to 3.5%.
By itself, a gain of 311,000 jobs with a 3.6% unemployment rate is objectively strong.
When one looks at the leading indicators within the report, several (the manufacturing work week, manufacturing employment, short duration unemployment less than 5 weeks) were negative, while the others either were only weakly positive with YoY deceleration (residential construction employment) or positive but still consistent with an established downtrend (temporary employment).
Also, while the relationship is somewhat noisy, growth of employment at food and drinking places of over 25% of the private total has tended to happen either very early or late in the employment cycle.
So: no imminent recession signaled, but some yellow caution flags going forward.
One month negative after a huge surge.
Good idea from the UK:
https://www.gov.uk/government/publications/cost-of-living-support/energy-profits-levy-factsheet-26-may-2022
Following record high oil and gas prices over the past year due to global circumstances, and to help fund more cost-of-living support for UK families, the government is introducing the Energy Profits Levy, a new 25% surcharge on the extraordinary profits the oil and gas sector is making.
This idea has been proposed here and I think we should do it. Now full disclosure, I learned about it by actually reading the blog of rightwing Tim Worstall (skip it as time is scarce and Timmy is worthless).
Yea I was trying to figure out how this Forbes idiot thought royalties of IKEA are best benchmarked by royalties charged by Starbucks. It seems arrogant old Timmie sucks at transfer pricing too.
There have been doubts about the accuracy of the payroll jobs number. One thing which gives some reassurance is that job growth is mostly in sectors which independently report job growth (leisure and hostility, nursing, etc) whole job losses are reported where one independently hears of job cuts (tech, finance, entertainment).
The birth/death model made a sizable contributions to employment in February, but not essentially the whole increase as was the case on October. The model subtracted jobs in January:
https://www.bls.gov/web/empsit/cesbd.htm
The drop in weekly hours cut into the gain in hourly workers household incomes pretty substantially in February, Still, a 0.1% rise following a 1.2% gain in January: is pretty happy news:
https://fred.stlouisfed.org/graph/?g=110Z9
“There have been doubts about the accuracy of the payroll jobs number.”
You may be referring to the incessant bloviating from Princeton Steve. By now – there is not a single person on the planet that takes this clown seriously.
I just read Kevin Drum downplaying the good news by noting the number of unemployed rose by 242 thousand. I would have thought Kevin would have noted the labor force participation rose by 419 thousand. Come on Kevin – do the arithmetic as he did notice the Household Survey employment number rose by 177 thousand. GEESH!
Off topic but in the news – Trump about to be indicted over the Stormy Daniels mess, which should remind us all of her appearance on Kimmel!
https://www.rollingstone.com/tv-movies/tv-movie-news/stormy-daniels-trump-penis-mushroom-kimmel-732426/
More on the SVB shock –
Trading in shares of First Republic, PacWest and Signature Bank was halted today dueto volatile trade, mostly downward. FR fell 15%, PacWest 38%. Signatures’s troubles were probably due in part to another big crypto lender announcing Thursday it will wind down.
Lots of tech paychecks are (were) written on u insured SVB accounts, so there will be delays in wage and salary payments.
There will be the usual portfolio adjustments, as losses in banking increase risk metrics for baking shares. Volatility engenders volatility for a while. Some of SVB’s assets will be liquidated, putting downward pressure on corporate bonds. Liquidity will be suppressed among depositors, limiting investment and hiring. Not a small deal, in all.
Investment and hiring on a small scale. SVB was a mess in 2019. It’s nothing new.
Putin has given JohnH a new job:
https://www.msn.com/en-us/news/world/vladimir-putin-orders-textbooks-be-rewritten-to-brainwash-kids-into-worshiping-invaders/ar-AA18tiEk?ocid=msedgdhp&pc=U531&cvid=e3f0091928554c5999fb38de8eda62b0&ei=8
Kremlin leaders have ordered an overhaul of Russia’s history curriculum in an attempt to brainwashing children into idolizing the Putin invasion of Ukraine. The curriculum, supervised by Putin Administration advisor Vladimir Medinsky, is believed to present soldiers as “heroes of the motherland” while avoiding any mention of Russia’s battlefield failures. The rewording of school books comes amid a war crimes investigation for countless atrocities committed by Russian troops, including rape, kidnapping, abuse, and murder.
Did Hitler do the same? I wonder if Jonny boy has a text saying how Auswitz was a noble venture. Of course the MAGA types are writing texts that suggest slavery was a wonderful way to treat people forced to move here from Africa.
I don’t want to be Chicken Little. And the Bernanke-era taper tantrum was an adjustment to expectations rather than to realized changes in rates and flows. But if we are going to compare this week’s financial events to any recent episode, I think it has more in common with the tantrum than with the housing crash or 2000. Maybe the unscheduled end of Fed tightening in 2019 is a fairer comparison than the tantrum, but one of those two.
The decline in bank reserves has been much larger this time than in 2019 or during and after the tantrum:
https://fred.stlouisfed.org/graph/?g=111tY
As Reuters points out, the effort to avoid default after the federal debt cap is reached leads to a shortage of Treasury bills, which causes a further reduction in liquidity, so tighter lending, so yet another reduction in liquidity:
https://www.reuters.com/markets/us/declining-us-bank-reserves-add-wrinkle-contentious-debt-ceiling-issue-2023-03-10/
Pretty icky, if you think about it. Here’s a quote from the article:
“…banks reliant on non-core funding, have deposit concentrations, or large unrealized losses in their securities portfolios could face more pressure in this environment.”
That’s a good description of Silicone Valley Bank, but not just them.
Here’s an obvious bit of context – another big reduction in liquidity is due to reverse repos, the Fed’s main tightening tool:
https://fred.stlouisfed.org/graph/?g=111xD
Apologies for the messy picture, but here’s what’s depicted: When Treasury began issuing debt to fund Covid programs, the unspent amounts went to the Fed, as seen in the red line. As the money was withdrawn from the Fed and spent, the Fed used reverses to sop up the excess liquidity created. That accounts for the rise in reverses up to Q4 of 2021 (blue line). The subsequent rise in reverses is part of the Fed’s tightening effort. Note how, as the rate paid on reverses (green line) rises beginning in March of last year, the volume of reverses begins to rise again. That’s a direct reduction in bank’s ability to lend.
Now, for the big deal for today’s developments. That additional increment in reverses since rates began to rise is also a direct reduction in bank’s ability to withstand runs on deposits. It’s roughly a $1 trillion reduction.
I don’t want to be Chicken Little (’cause I’m a duck), but this poorly-structured mini-essay is background for this week’s banking splat.
That is incorrect. Banks have excess reserves in so they can increase lending as they leisure. A infrastructure bubble is likely as banks look to move money into “safe” state assets. Most of what you talk about is high yield tech, which makes up little investment in total. The weak growth of 2014-19 should have been a lesson.
Which “that” are you declaring to be incorrect?
I used to have huge arguments with a certain someone on this blog that when these banks were in trouble it was not because of reverse repos but because lack of proper capital/equity. I think this recent real life example verifies my point. Who is having the problems right now?? Not all banks, just the ones with badly managed portfolios and poorly executed “maturity mixtures” or “maturity matching”—i.e. not enough equity/capital. But, as we know, after certain people shot their mouth off (or keyboard) about things they don’t know about, they can’t “walk it back” and so he became an amplifier for TBTF banks lies, which is probably why he came on here bragging about how he was invited to banker funded conferences/symposiums to talk about things he didn’t know. If I was the TBTF bankers association who wanted some misguided person to repeat my talking point lies, I would have invited him as well. Put him up in a hotel and give him 6+ square meals. Why not?? He’s “playing ball” on the speaking podium~~ignorantly or otherwise.
https://econbrowser.com/archives/2019/12/the-return-of-the-feds-balance-sheet-policies
https://econbrowser.com/archives/2019/11/guest-contribution-yet-another-look-at-the-recent-inversion-of-the-yield-curve
Anyone who followed that issue closely was aware who actually knew what they were talking about, and who was talking from their nether region. Just like someone saying they knew what they were talking about on an invasion of Ukraine that “would never happen” because they are self-labeled “expert on Russia”.
As petty as it may be, I can’t resist adding, one of my favorite parts of one of those two threads, is when Manfred, Manfred~~~of all people, shows up to give him a one sentence compliment on his thoughts on reverse repos and “liquidity issues”, after which said blowhard responds like he was just knighted by the Queen of England.