Reader JohnH critiques my post on real mortgage rates thusly:
With rates changing rapidly this month, the results can change overnight, making the date of the data critical. I provided my inflation assumption and my mortgage rate assumption. None of that was provided in the above chart. And no actual data was provided.
In addition, the after tax calculation depends a lot on the tax bracket assumed. All information about the tax bracket came in the statement about “even for the highest tax brackets.”
In this spreadsheet, I include all the series used to construct the the following three graphs. The spreadsheet is laid out simply enough that I believe an idiot can follow along.
First, calculating the after tax rate for the highest income bracket. If one is trying to show that all real rates are above zero, one wants to use the highest marginal tax rate which pushes down the after tax rate the most. In Figure 1 below, I show the highest marginal tax rate (black line, right scale), and the 30 year fixed rate (blue line, left scale). Applying the adjustment for the maximum tax rate yields the tan line below. If one uses any other tax bracket, the after tax rate will be higher.

Figure 1: Before tax 30 year fixed mortgage rate (blue, left scale), and after tax (tan, left scale), all in percent; maximum marginal tax rate (black, right scale, %). Source: Fannie Mae via FRED MORTGAGE30US, Treasury via FRED, author’s calculations.
Now, consider the 15 year after tax mortgage rate. I only have one measure for 15 year expected inflation (the Cleveland measure). I proxy the 15 year with the 10 year measures from Treasury-TIPS breakevens, adjusted breakevens, and SPF 10 year median. This gives the following picture.
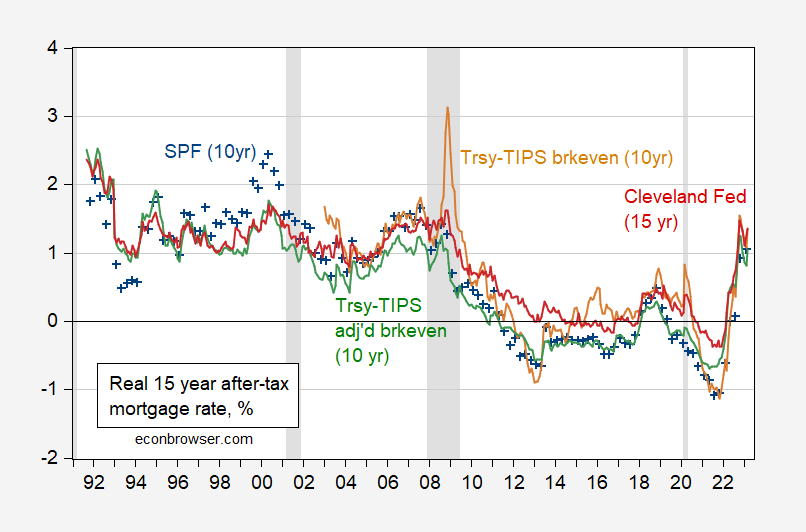
Figure 2: 15 year after tax mortgage rates adjusted by Survey of Professional Forecasters median 10 year expected inflation (blue +), adjusted by Treasury-TIPS 10 year breakeven (tan), adjusted by Treasury -TIPS 10 year breakeven adjusted for risk, liquidity premia (green), and adjusted by Cleveland Fed 15 year inflation forecast (red). Source: For mortgage rates, Fannie Mae via FRED series MORTGAGE15US; Treasury and TIPS from FRED (GS5, FII5), for adjusted breakeven KWW (accessed 4/8), for SPF Philadelphia Fed, for 15 year forecasted inflation Cleveland Fed, and NBER.
For 30 year mortgages, we can match exactly using 30 year breakevens, and 30 year Cleveland Fed forecasts.
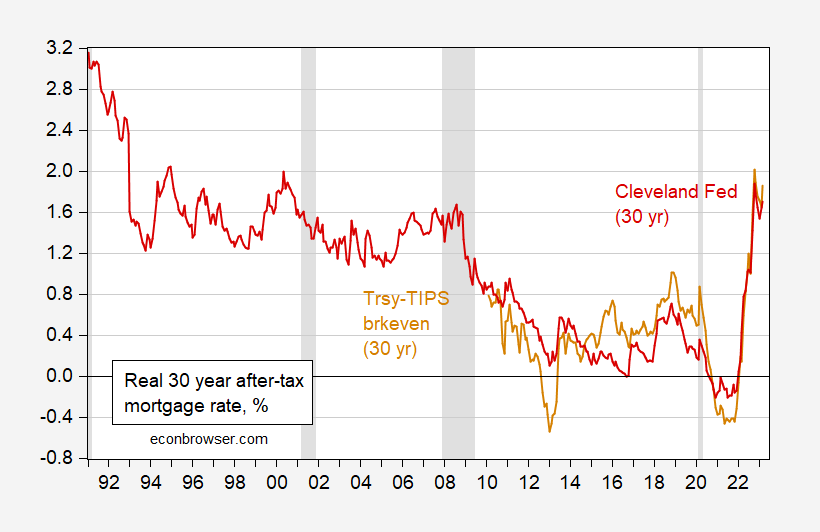
Figure 3: 30 year after tax mortgage rates adjusted by adjusted by Treasury-TIPS 30 year breakeven (tan), and adjusted by Cleveland Fed 30 year inflation forecast (red). Source: For mortgage rates, Fannie Mae via FRED series MORTGAGE30US; Treasury and TIPS from FRED (GS30, FII30), for adjusted breakeven KWW (accessed 4/8), for 30 year forecasted inflation Cleveland Fed, and NBER.
If it is not clear to the casual observer, I will note that the real mortgage rate, even after assuming the highest marginal tax rate which yields the lowest nominal rate, is now above zero.
Reader JohnH asserts that using one year lagged inflation is appropriate. I document that the lagged one year CPI inflation rate is a poor predictor for subsequent five year inflation; it is likely even worse for the subsequent 15 or 30 year inflation.
Finally, the assertion that rates change quickly so that monthly characterizations are not apt is not validated. In Figure 4, I show weekly nominal pre-tax mortgage rates, and the inflation expectation adjusted weekly rates. No drastic swings are exhibited.
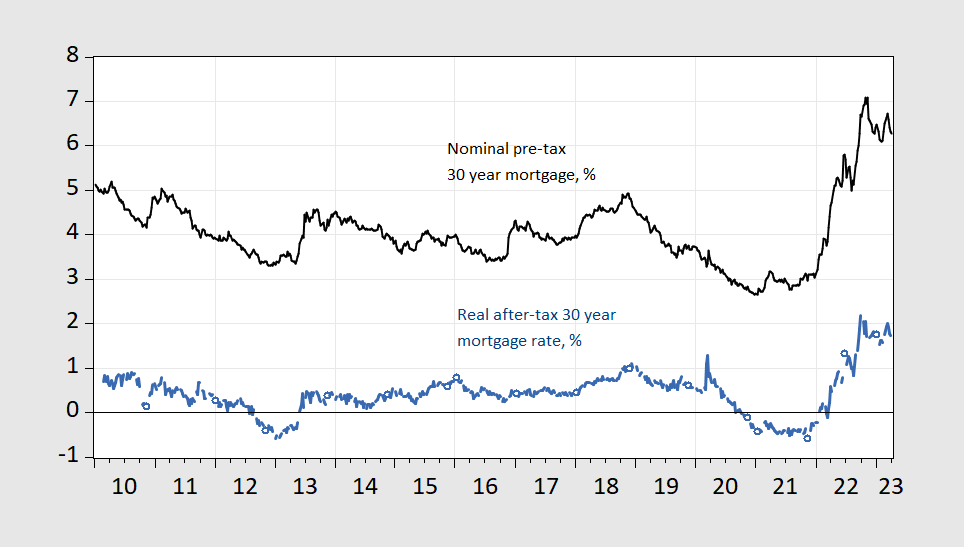
Figure 4: Nominal 30 year fixed mortgage rate, weekly ending Thursday (black), and nominal yield adjusted by maximum tax rate, and subtracting off 30 year inflation breakeven (blue), both in %. Source: Fannie Mae via FRED, Treasury via FRED, and author’s calculations.
Hence, I conclude: ex ante mortgage rates are currently positive.
Professor Chinn,
The spreadsheets appear not to come-up if that is the correct phrase to use.
AS: Thanks. Links fixed.
‘JohnH asserts that using one year lagged inflation is appropriate.’
Is Jonny so uninformed that he thinks adaptive expectations are still in fashion? Or does Jonny think he is allowed to just make up stuff as he goes. After all Princeton Steve does that all the time.
This reminds me of the first blog post from Kevin Drum who took down some stupidity from Stephen Moore. Moore complained that the tax rate on corporate profits after being dividended down to some rich but stupid from a tax planning perspective rich dude was 73%. After all the corporate tax rate (tc) used to be 35% and the personal tax rate (tp) = 38%.
But wait tp(1 – tc) + tc is less than 60.
Now Moore later corrected his stupid blog post thanking his conservative readers. Kevin Drum is conservative?
Philip Klein at the National Review is pulling another Bruce Hall
https://jabberwocking.com/federal-spending-is-back-down-to-normal/
“Under President Biden, massive spending has fueled not only high deficits but also inflation.”
Fortunately checks the facts and Klein was lying – which is what one does when one writes for the National Review.
Menzie – setting aside the noble and necessary but Sisyphean task of correcting the blog’s trolls – I wonder what would be the response to this?: https://finance.yahoo.com/news/tumbling-money-supply-alarms-economists-040000341.html First these folks were complaining raise interest rates to cure inflation! Credit is too easy for poor people! and now they are complaining that the money supply too restrictive? It seems to me that they are in search of a narrative to explain their policy recommendations.
“Central bankers have raised interest rates too far and, if the so-called monetarists are proved right again, they say there should be a “clear out” of officials. The views are held by British economists Simon Ward, economic adviser to Janus Henderson, and Tim Congdon, the UK’s leading voice on the subject and once an adviser to Margaret Thatcher when she was prime minister.”
This trio was right about something? I guess whoever wrote this has not read Dr. Chinn’s take down of their writings.
I accept your data and calculations. However, the issue I have with this is that these are not “real” interest rates. Real interest rates consist of what has been realized and validated. What is presented consists of ESTIMATED inflation resulting in ESTIMATED real interest rates. Given the poor performance of inflation forecasts over the past couple years, I have low confidence what has been called “real” interest rates going forward.
Here’s a good example of badly inflation expectations have fared: https://johnhcochrane.blogspot.com/2022/10/inflation-expectations.html Could this actually be an example of Keynes’ beauty contest?
And the more we expect that estimated inflation is being underestimated, which given recent history is a reasonable assumption, the lower the “solidy real” but actually estimated inflation-adjusted “real” rate becomes.
The data I can rely on is the 2023M03 mortgage rate of 6.54% and the CPI-U inflation rate of 6.0%, which makes the REAL mortgage rate 0.54%. Adjusted for taxes, it comes out to 0.34%–a helluva deal. Even paying a tax adjusted ESTIMATED REAL mortgage rate of 1.8% isn’t all that bad!
“Real interest rates consist of what has been realized and validated.”
OK – you are a moron. One last time. Ex ante real rate = nominal rate minus EXPECTED inflation rate.
Now the actual real rate = nominal rate minus actual inflation rate over the life of the contract.
Now I will type this S-L-OW-L-Y hoping you get this (I doubt it). The actual inflation rate on a loan taken today cannot be observed for quite a while and is very unlikely to be the historical inflation rate you keep using.
Jonny boy – these are basic concepts that even 4 year old children can grasp. But not little Jonny boy.
John Cochrane and Torsten Slok at Apollo Global Management. Yea – you are one right wing nutcase.
I think JohnH should just watch more “A Team”. Know why?? Because B.A. Baracus “Pity the fool”
Classic!
“The data I can rely on is the 2023M03 mortgage rate of 6.54% and the CPI-U inflation rate of 6.0%, which makes the REAL mortgage rate 0.54%.”
For the millionth time, last period’s inflation rate is a very poor measure of expected future inflation.
Anyone who does not get this should avoid posting comments on an economics blog.
Wait – your own right gurus wrote this?
‘Inflation will be coming down over the coming quarters. This is what the Fed is predicting, that is what the consensus is expecting, and that is what we are predicting.’
Another situation where Jonny boy is too stupid to read his own links!
Wait – did Jonny boy note the date of the Cochrane link? Back in October 2022. Come on Jonny boy – can you be more dishonest? Inflation since then has come down – much in line with what expectations noted.
Yea – we all know inflation spiked in late 2021 and early 2022. But to claim inflation has been widely above expectations by relying on a blog post from last fall is beyond dishonest. But then that is what Jonny boy does – LIE & LIE & LIE.
Johnny, who are you to tell “real’ economists how to define “real” interest rates? You aren’t that important. Using ALL CAPS doesn’t mean you win.
“Real” is generally intended, in discussing interest rates, to mean adjusted for expected or realized inflation. I won’t even bother to provide a link. I shouldn’t have to.
You keep insisting that inflation expectations are poorly formed, despite evidence that your own preference for using 12-month historic inflation as a forecast is just about the worst choice you can make. Again, your views don’t matter. Your nobody – a loud nobody, but still nobody.
ESTIMATED. Is Jonny serious? I’m watching the local news and my weather is forecasting a warm Wednesday. So I put up the AC. Silly me is this forecast was only the ESTIMATED temp for tomorrow. Maybe Jonny thinks it will snow in Brooklyn tomorrow.
Kevin Drum mocked something at the National Review that tried to pretend Federal spending was exploding. The National Review nitwit in question took one portion of this document from CBO:
https://www.cbo.gov/system/files/2023-04/58995-MBR.pdf
Net outlays for interest on the public debt increased by $90 billion (or 41 percent), mainly because interest rates are significantly higher than they were in the first six months of fiscal year 2022.
CBO is using the nominal interest rate here but it would be more informative if they used the real rate:
https://fred.stlouisfed.org/series/DFII10
Market Yield on U.S. Treasury Securities at 10-Year Constant Maturity, Quoted on an Investment Basis, Inflation-Indexed
It seems real rates were negative in the first part of 2022 but recently have increased over 1%. Higher but not exactly that high.
The weather man here forecasted that the high temperature for Brooklyn would be 71 degrees. Now if you forecasted things like this JohnH style, the forecast would be yesterday’s high of 66 degrees.
Wait – it is still earlier and the temperature is already 70 degrees. So much for naive forecasting methods.
Now suppose the temperature rises to 73 degrees this afternoon. Little Jonny would take this forecast error to mean my weather man is an idiot and we should adopt the Jonny boy method of forecasting.
Yea – little Jonny boy is that incredibly dumb.
JohnH goes back to a Oct. 22, 2022 blog post from John Cochrane in order to justify his weird claim that expected inflation is still high. Wait Cochrane wrote this two months later:
https://johnhcochrane.blogspot.com/2023/01/waning-inflation-supply-and-demand.html
Inflation seems to be waning. The conventional change from a year ago:
The month to month changes now suddenly more popular on the way down than it was on the way up:
Informative FRED graphs for both. It is now well estimated that JonnH is an incredibly dishonest troll.