CBO projections of debt, normalized by GDP and potential GDP, from before December passage/signing (CBO June 2017) and after (April 2018).
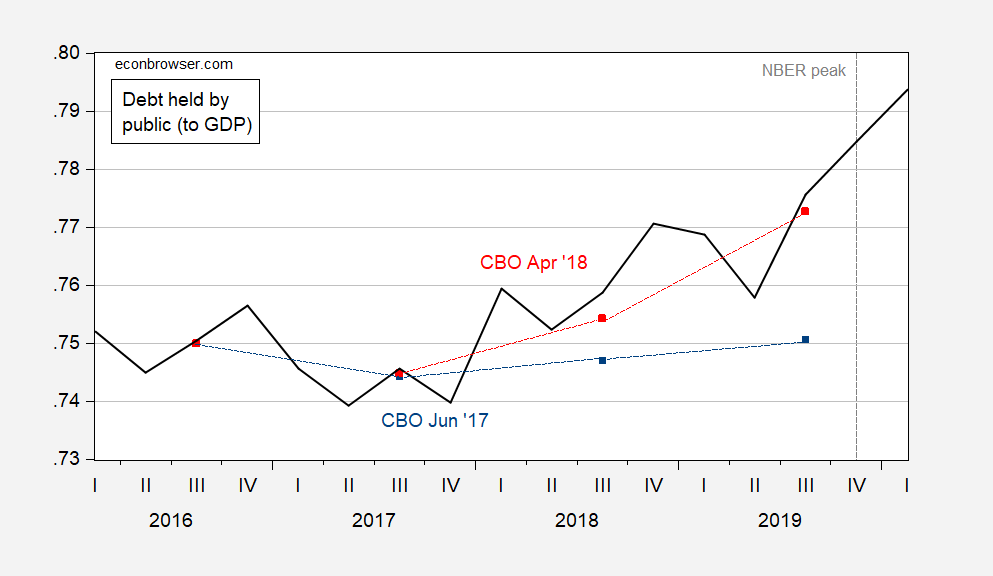
Figure 1: Federal debt held by public CBO projection as of Jun 2017 (blue squares), and as of April 2018 (red squares), divided by nominal GDP. Sources: CBO, Budget and Economic Outlook, June 2017, April 2018, BEA, and author’s calculations.
Here is debt, normalized by CBO estimated potential GDP.
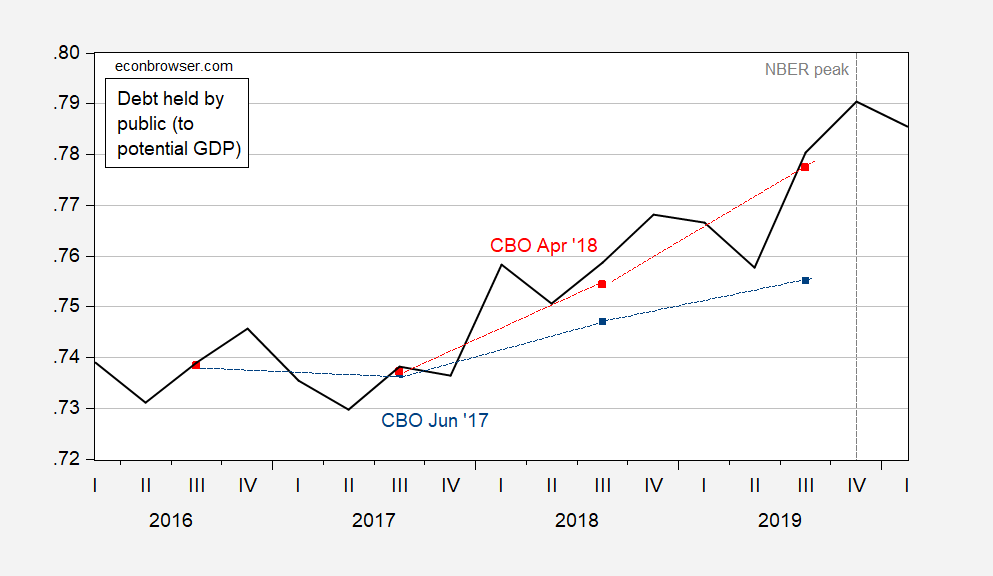
Figure 2: Federal debt held by public CBO projection as of Jun 2017 (blue squares), and as of April 2018 (red squares), divided by nominal potential GDP. Sources: CBO, Budget and Economic Outlook, June 2017, April 2018, July 2023 (for potential GDP), and author’s calculations.
While one cannot impute the entire change in the debt-to-GDP ratios to the TCJA, we do know that using non-fanciful estimates, TCJA was going to blow a hole in government finances (see e.g. here). What were the deficit hawks of today saying back then (at a time when the output gap was arguably pretty small)? (Aside from CRFB, who were against TCJA.)
It’s all in the vertical scale. Small changes become very large changes. Do the same thing for 2007-10.
https://fred.stlouisfed.org/series/GFDEGDQ188S
Why are you still chirping your BS? I will say our resident Village Moron finally figured out to do this relative to GDP (which Princeton Stupid Steve has not figured out) but if you want to blame Obama for the 2008 melt down of financial markets, make your case. This should be a lot of fun!
Bruce Hall The vertical scale you choose does not affect the change in the slope. The slope went through an inflection point and started to increase.
Brucie was never good with basic math but I hear he is studying How to Lie with Statistics.
Apparently Bruce is so poorly read he’s never heard the story of how “W” Bush’s Treasury Secretary Hank Paulson got on bended knee to Nancy Pelosi to pull his and Bush’s a$$ out of the frying pan.
https://money.usnews.com/money/blogs/the-inside-job/2008/09/26/hank-paulson-kneeling-before-pelosi
It was laid out in the “liberal bastion” known as Rupert Murdoch’s Wall Street Journal.
I think even the below average Joe is catching on to the fact that the only thing Republican tax cuts stimulate is the national debt.
Wishful thinking on your part. Which small town diner did you hear this sentiment at?? The Denny’s a stones throw from Smith College??