Today we are pleased to present a guest contribution by Jamel Saadaoui (University of Strasbourg) and William Ginn (LabCorp, Artificial Intelligence).
How do geopolitical risk shocks affect monetary policy? After the global financial crisis, international trade relations have been increasingly influenced by geopolitical considerations. Indeed, it is now widely recognized that geopolitical risks and bilateral political tensions can have a strong influence on the functioning of the economy (Caldara and Iacoviello, 2022). Geopolitical risk shocks affect the economy through different channels. Some of them are inflationary, such as the commodity price channel, especially the oil price (Mignon and Saadaoui, 2024) [Econbrowser post] and the currency channel (Gopinath, 2015). Furthermore, other channels are deflationary, such as the consumer sentiment channel and the financial condition channel (Forbes and Warnock, 2012). It is difficult to determine ex-ante whether geopolitical risk shocks are inflationary or deflationary. Recent research suggests that geopolitical shocks tend to be inflationary throughout history (Caldara et al., 2022).
Based on a panel of 20 economies, William Ginn and I develop and estimate an augmented panel Taylor rule via linear and nonlinear local projections (LP) regression models. First, the linear model suggests that the interest rate remains relatively unchanged in the event of a geopolitical risk shock. Second, the result turns out to be different in the nonlinear model, where the policy reaction is muted during an expansionary state, which is operating in a manner proportional to the transitory shock. However, geopolitical risks can amplify the policy reaction during a non-expansionary period.
To consider the global impact of geopolitical risk, we use a rich data set for industrial production, consumer price index (CPI), short-term interest rate, GPR, and EPU for 20 economies that represent around 82% of global GDP to analyze the effect of GPR on interest rates. These twenty economies include the following: Brazil (BRA), Switzerland (CHE), Chile (CHL), Canada (CAN), China (CHN), Columbia (COL), Czech Republic (CZE), Euro zone (19 countries; EUR), United Kingdom (GBR), Hungary (HUN), Ireland (IRL), India (IND), Israel (ISR), Japan (JPN), Mexico (MEX), South Korea (KOR), Poland (POL), Russia (RUS), Sweden (SWE) and the United States (USA). We use monthly data that cover January 1999 to February 2022.
The international data for the explained and explanatory variables of the 20 economies are shown in Figure 1. In the output growth data, we can clearly see three episodes of global slowdown, namely the Internet Bubble in 2001, the Global Financial Crisis in 2008-2009, and the pandemic in 2020. The graphs for inflation show a more dispersed situation over time and between countries, except for the global financial crisis and after the pandemic. In terms of monetary tightening and loosening, we also observe that the monetary cycles induced by the global financial crisis (easing) and after the pandemic (tightening) are the most synchronized episodes. Furthermore, Economic Policy Uncertainty is larger after the pandemic. During the most recent period, we can observe elevated levels of GPR due to the War in Ukraine. More generally, the GPR has known large spikes around 2001 due to 9/11 and after 2009 due to rising tensions between the United States and China and the election of Donald Trump, as discussed in Mignon and Saadaoui (2024).
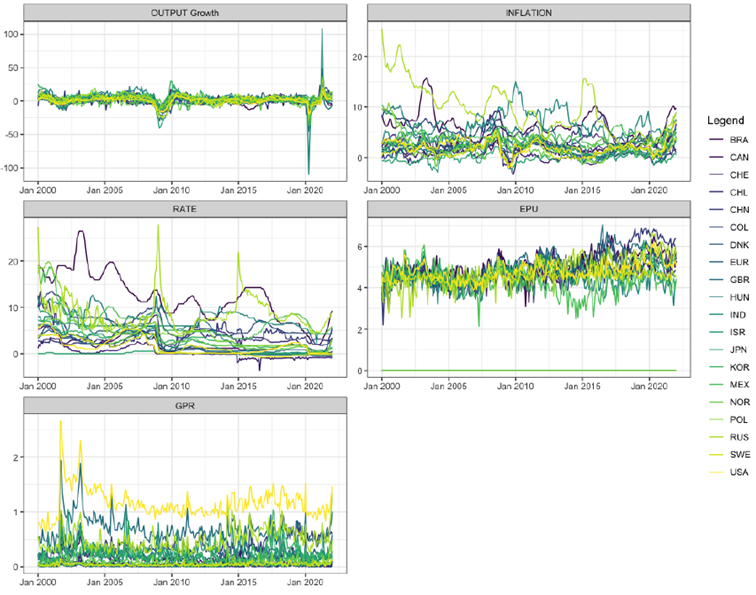
Figure 1: International Data
The Taylor rule is designed to capture the reaction of central banks to deviations in inflation and output (Taylor, 1993). By examining the rule in expansionary and non-expansionary states, this research may offer insight into how central banks adjust interest rates in response to economic conditions in the presence of geopolitical shocks. The LP model, developed by Jordà (2005), is used to estimate an augmented Taylor rule based on a GPR shock. Periods marked by high GPR have potentially adverse consequences for an economy. Central banks, when implementing monetary policy, consider the prevailing economic conditions, including states of uncertainty and geopolitical tensions. The Taylor rule provides a framework for central banks to adjust interest rates based on economic indicators, where we test whether this adjustment can be influenced by the level of the GPR.
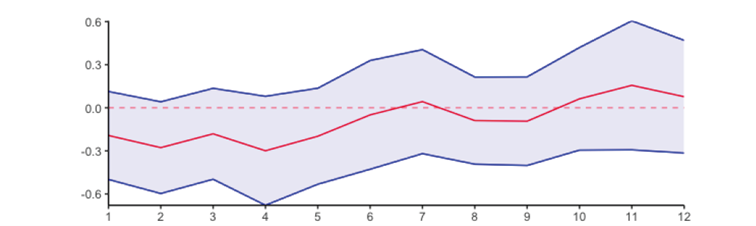
Figure 2: Linear LP model
Note: the shock is a one standard deviation shock to changes in GPR. Confidence intervals at 90%.
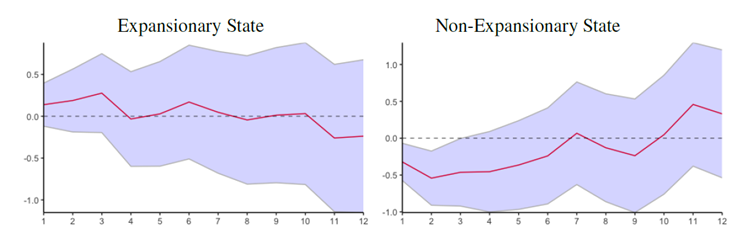
Figure 3: Non-linear LP model (Transition variable: twelve-month centered movingaverage of the output growth rate) – Baseline
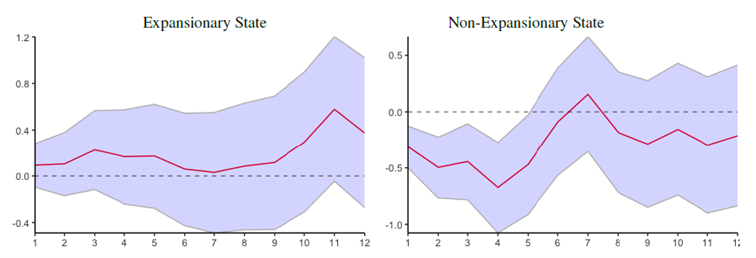
Figure 4: Non-linear LP model (Transition variable: recession dummy)
Overall, the linear LP (Figure 2) model demonstrates a negative relationship between the monetary policy reaction and the GPR shocks, where the policy reaction declines and is statistically insignificant. The non-linear model (Figure 3 and 4) demonstrates that a GPR shock results in a muted interest rate policy response during an expansionary state. There is no policy dilemma where the interest rate response is operating in a manner that is proportional to the transitory nature of the shock and considering the effect of monetary policy comes with a lag. The impact of a GPR shock on monetary policy turns out to be different during a non-expansionary state. The findings show that the response becomes accommodative and is statistically significant for numerous periods. This last result is robust to the choice of the transition variable (GDP, OG with HP filter, dummy variables for recessions, EPU). That being said, this more accommodative monetary policy after geopolitical risk shocks is observed in the group of more independent central banks and in the group of emerging countries (Figure 5 to 8).
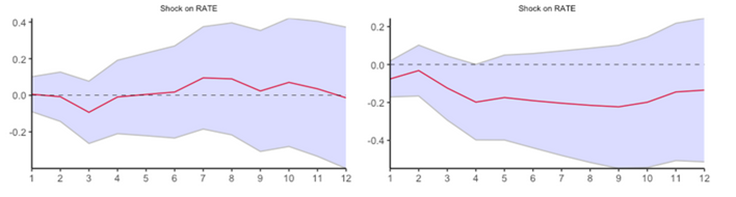
Figure 5: Baseline model Non-linear LP – Advanced Economies: CAN, CHE, DNK, EUR, GBR, JPN, KOR, NOR, SWE, USA
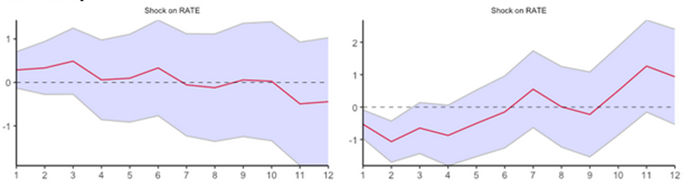
Figure 6: Baseline model Non-linear LP – Emerging Economies: BRA, CHL, CHN, COL, HUN, IND, ISR, MEX, POL, RUS
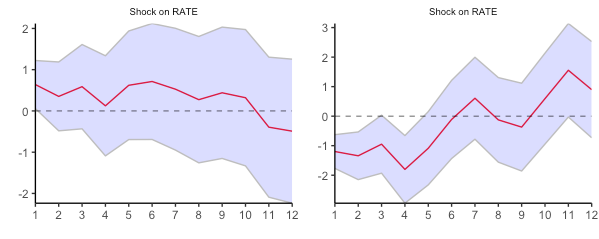
Figure 7: Baseline model Non-linear LP – More independent central banks (Central Bank Independence – Dincer and Eichengreen, 2014): CAN, CHL, EUR, HUN, MEX, NOR, RUS, SWE
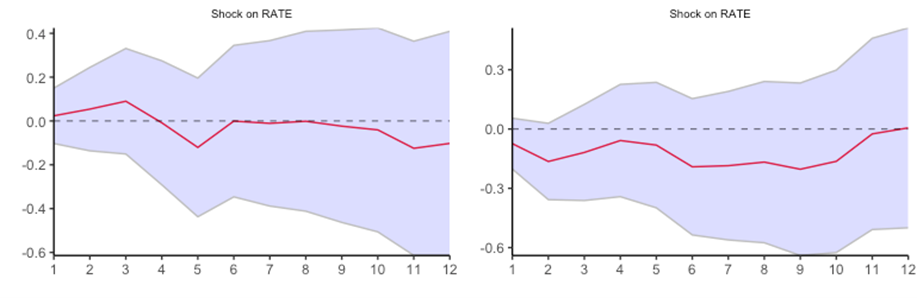
Figure 8: Baseline model Non-linear LP – Less independent central banks (Central Bank Independence – Dincer and Eichengreen, 2014): CHN, COL, DNK, GBR, IND, ISR, JPN, KOR, POL, USA
Main references
Caldara, D., Conlisk, S., Iacoviello, M. and Penn, M. (2022), ‘Do geopolitical risks raise or lower inflation’, Federal Reserve Board of Governors.
Caldara, D. and Iacoviello, M. (2022), ‘Measuring geopolitical risk’, American Economic Review 112(4), 1194–1225.
Dincer, N. N., & Eichengreen, B. (2014), ‘Central Bank Transparency and Independence: Updates and new measures’, International Journal of Central Banking 10(1), 189-259.
Mignon, V. and Saadaoui, J. (2024), ‘How do political tensions and geopolitical risks impact oil prices?’, Energy Economics 129, 107219.
* The authors thank Menzie Chinn for a useful suggestion and Elena Pesavento for guidance on state-dependent local projections. The interested readers can find the last version of the paper on SSRN: https://papers.ssrn.com/sol3/papers.cfm?abstract_id=4762672
This post written by Jamel Saadaoui and William Ginn.