Neil Irwin at the NYT has an interesting article on the localized recession in 2016. One conclusion he makes:
Continue reading
Author Archives: Menzie Chinn
JP Morgan Chase: “U.S.-China endgame involving 25 percent U.S. tariffs on all Chinese goods in 2019”
That’s according to Bloomberg.
Learning from History and Modeling: Chinese Trade Retaliation Choices
An interesting symposium in the 2nd Quarter 2018 issue of Choices, published by the Agricultural and Applied Economics Association, deals with the impact of Chinese trade retaliation aimed against US agricultural exports.
And Back in Fiscal-Land
The FY2019 projected deficit balloons, as the estimated “dynamic” effects of the Tax Cuts and Jobs Act prove minor (quelle suprise!)
Continue reading
Minnesota Powers Ahead, Wisconsin Flatlines
According to the Philly Fed coincident indices.
Continue reading
US Tariff Levels Now at Emerging Market Levels
The following graph compares average tariff levels across countries.
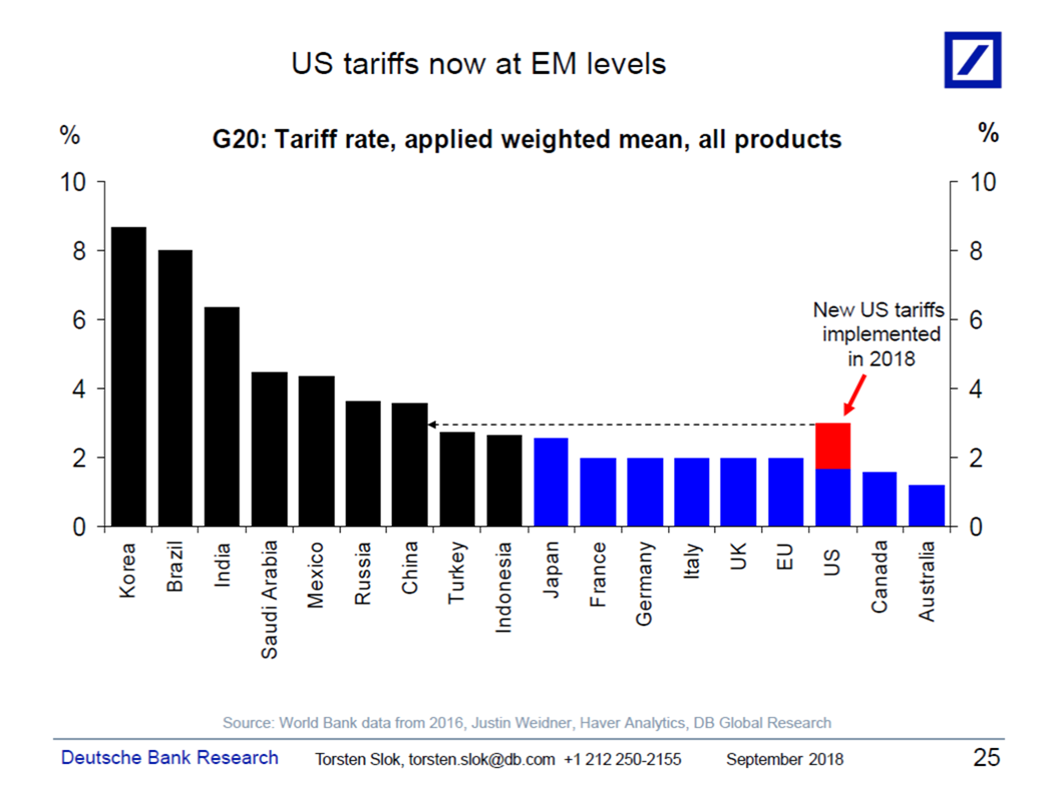
One can take comfort from the fact US tariff rates are historically low.
I have two observations:
- We live in an era of global value chains, so that the value added has been chopped up and split across nations. In this context, a tariff of 10% on final value is a lot more than 10% on value added.
- This shock to global value chains comes on the back of an already stretched logistics network.
The latter point is highlighted by the following graph:
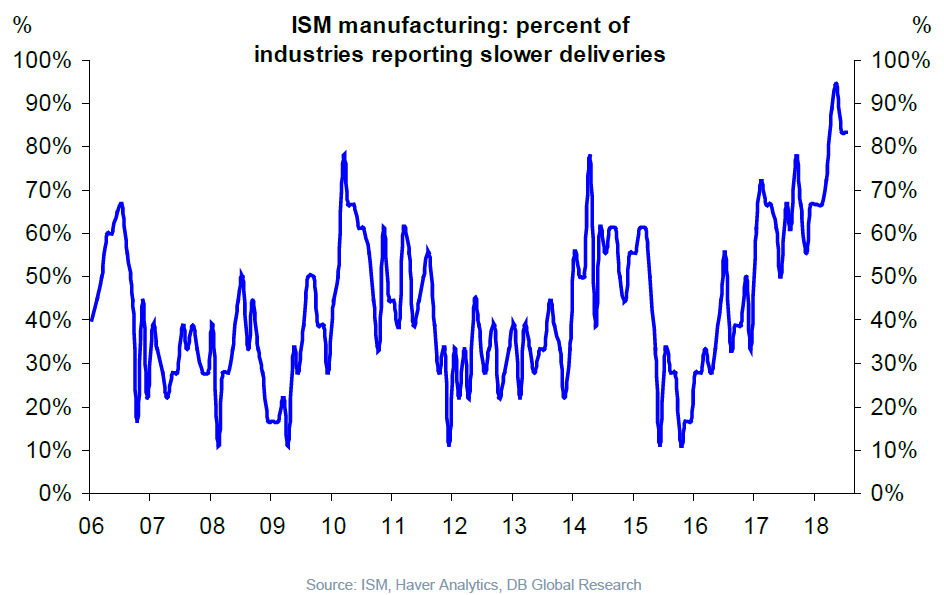
The latter is perhaps a temporary phenomenon, likely to end when the economy goes into recession. However, the former is likely more persistent.
Global value chains have been built up over decades; rejiggering these chains to accommodate tariffs of indefinite duration is sure to be disruptive, possibly inflationary (although that depends on monetary policy).
Guest Contribution: “Fall in US Trade Balance, Led by Ag. Exports”
Today, we present a guest post written by Jeffrey Frankel, Harpel Professor at Harvard’s Kennedy School of Government, and formerly a member of the White House Council of Economic Advisers.
“Trade Wars Are Good, and Easy to Win”: Soybean Edition
I am dubious. End-market year soybean stocks at record highs.
Does the Fed Care about the Rest-of-the-World?
That’s a title I borrowed from a paper by Barry Eichengreen; the actual title is “International environment and US monetary policy: a textual analysis” written by Laurent Ferrara and Charles-Emmanuel Teuf:
What role does the international environment play in shaping US monetary policy decisions? To measure its influence, we construct an international indicator extracted from minutes of Fed monetary policy committee meetings.
Political Calculations on Soda Tax Concludes: No Externalities Internalized
Finally, Ironman at Political Calculations understands what an externality is. Instead of this:
If a deadweight loss exists, it represents the amount of economic activity that has been directly lost because of the imposition of the tax, which tells us the degree to which the city’s economy may have shrunk as a result.