Freight movement as measured by the BTS Freight Transportation Services index is down, relative to trend.
Category Archives: recession
Recession Probability for Term Spread thru 2/24
If the last few days of February is like the rest, then recession probabilities are up. Using a plain-vanilla probit model of recession based on the10yr-3mo spread, the following recession probabilities are obtained.
10yr-3mo Treasury Spread and TIPS 10yr
Figure 1 shows both of these at monthly frequency, with February data through 2/21.
What Method Implies 80% Probability of Recession by Nov 2020?
It’s the method described in this intriguing paper, by William Kinlaw, Mark Kritzman, and David Turkington. From the abstract:
The authors introduce a new index of the business cycle that uses the Mahalanobis distance to measure the statistical similarity of current economic conditions to past episodes of recession and robust growth. Their index has several important features that distinguish it from the Conference Board’s leading, coincident, and lagging indicators. It is efficient because as a single index it conveys reliable information about the path of the business cycle. Their index gives an independent assessment of the state of the economy because it is constructed from variables that are different than those used by the NBER to identify recessions. It is strictly data driven; hence, it is unaffected by human bias or persuasion. It gives an objective assessment of the business cycle because it is expressed in units of statistical likelihood. And it explicitly accounts for the interaction, along with the level, of the economic variables from which it is constructed.
Eight Graphs Depicting the Macro Situation as of end January
For now, we know as of 2019Q4, we’re not in a recession, according to Jim’s analysis. But Q4/Q4 GDP growth fails to hit Trump targets (again!), business cycle indicators continue to plug along, but RV sales plunge 16% y/y. And yield curve inverts (again)! Is it flight to safety or lower expected future short rates?
Spot the Incipient Recession
Most accounts these days suggest the risk of recession has abated, given the strength of various indicators, and the un-inversion of the yield curve. This made me wonder what two key indicators look like in real time on the eve of a recession. Take a look at these two graphs, to see which one denotes data just before a recession.
Business Cycle Indicators as of Today
December industrial production (red line) adds to the (mixed) picture…
Is Employment Growth (a Lot) Lower Than We Think?
Yesterday’s employment release indicated a deceleration in nonfarm payroll (NFP) employment growth. Data from other sources suggests that the deceleration over the last year is more marked than indicated by the establishment survey.
Business Cycle Indicators, End-2019
Here are some key indicators tracked by NBER’s Business Cycle Dating Committee:
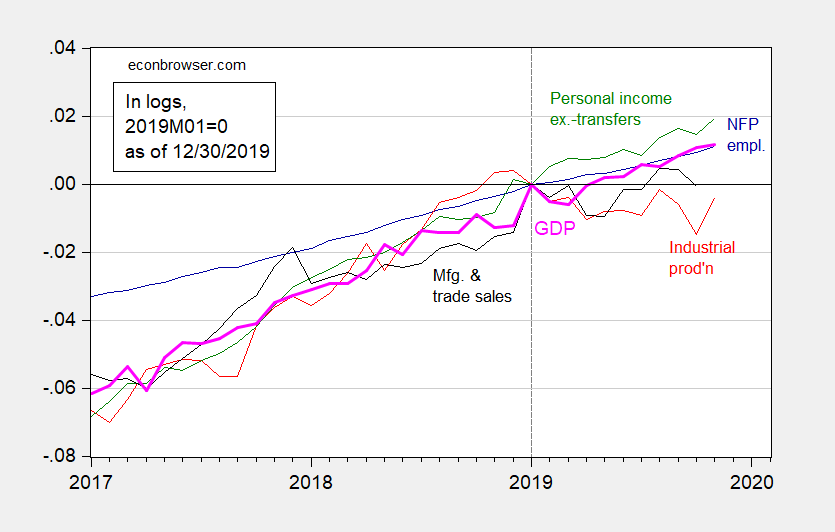
Figure 1: Nonfarm payroll employment (blue), industrial production (red), personal income excluding transfers in Ch.2012$ (green), manufacturing and trade sales in Ch.2012$ (black), and monthly GDP in Ch.2012$ (pink), all log normalized to 2019M01=0. Source: BLS, Federal Reserve, BEA, via FRED, Macroeconomic Advisers (12/30 release), and author’s calculations.
Business Cycle Indicators, December 9th
[Inflation adjusted] Personal income excluding transfers and industrial production are falling in October, even as employment rises in November.