The Senate parliamentarian ruled the trigger to prevent a revenue shortfall as unacceptable, thereby temporarily stymieing the bill.
Category Archives: taxes
JCT Dynamic Score of the TCJA: $1 Trillion Revenue Loss
And GDP is only averaging a paltry 0.8% above baseline level over 10 year period, given these massive, regressive tax cuts. Revenue effects:
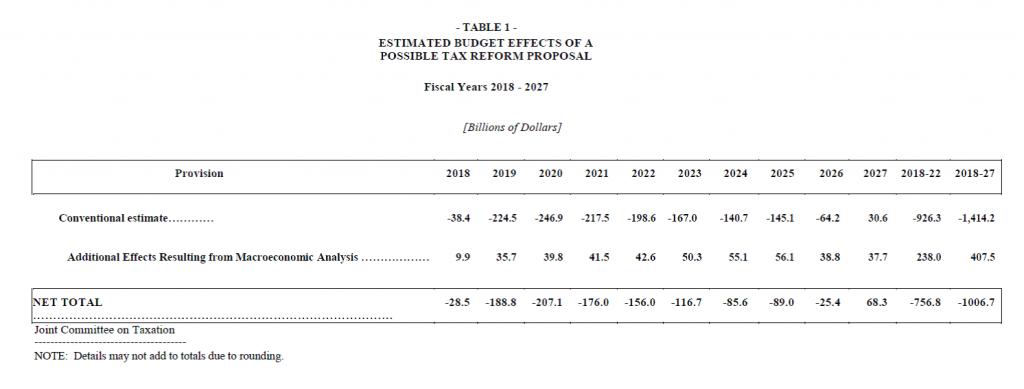
Source: JCT (November 30, 2017).
When Tax Cuts Last in the Congress Bloom’d … and War Loomed
My stint in the Executive Office of the President as a senior economist spanned the last months of the Clinton Administration and the first months of the G.W. Bush Administration. In the first months of 2001, we knew massive tax cuts were coming; we weren’t so sure that we’d be in a long term ground war on the Asian continent.
Continue reading
A Tax Plan for the Season
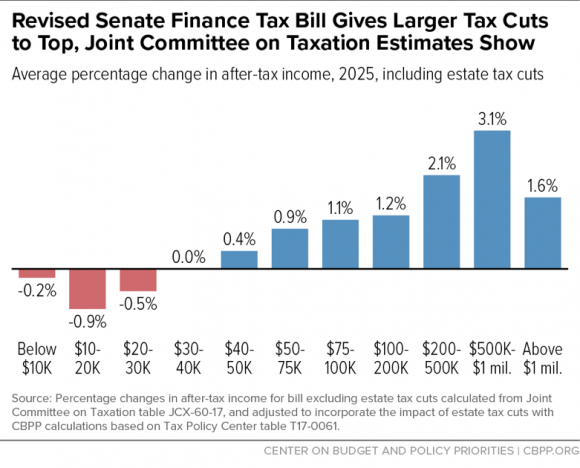
The Joint Committee on Taxation (JCT) has evaluated the distributional impact of the Senate’s plan. CBPP has graphically depicted the impact on households, adjusting the JCT figures to account for the provisions regarding estate taxes:
Source: CBPP.
Continue reading
Guest Contribution: “Which Reagan Tax Reform is This One Like?”
Today, we present a guest post written by Jeffrey Frankel, Harpel Professor at Harvard’s Kennedy School of Government, and formerly a member of the White House Council of Economic Advisers. A shorter version appeared in Project Syndicate.
Federal Spending Implications of the House GOP Tax Plan: $25 bn Off of Medicare …
As noted in this earlier post, the distributional consequences of the House Tax Cuts and Jobs Act should include the spending cuts. According to CBO, there will be a $25 billion cut to Medicare unless independent legislation is passed. From TPM:
…automatic cuts spring into action anytime Congress passes a bill that balloons the federal deficit, as the tax bill would. The approximately $136 billion in cuts spurred by the GOP tax bill would hit a number of government programs—including farm subsidies and the Border Patrol—but would cut most deeply into Medicare. Medicaid, Social Security, and food stamps are protected.
Distributional Consequences of the Tax Cuts and Jobs Act
Here’s a metaphorical picture:
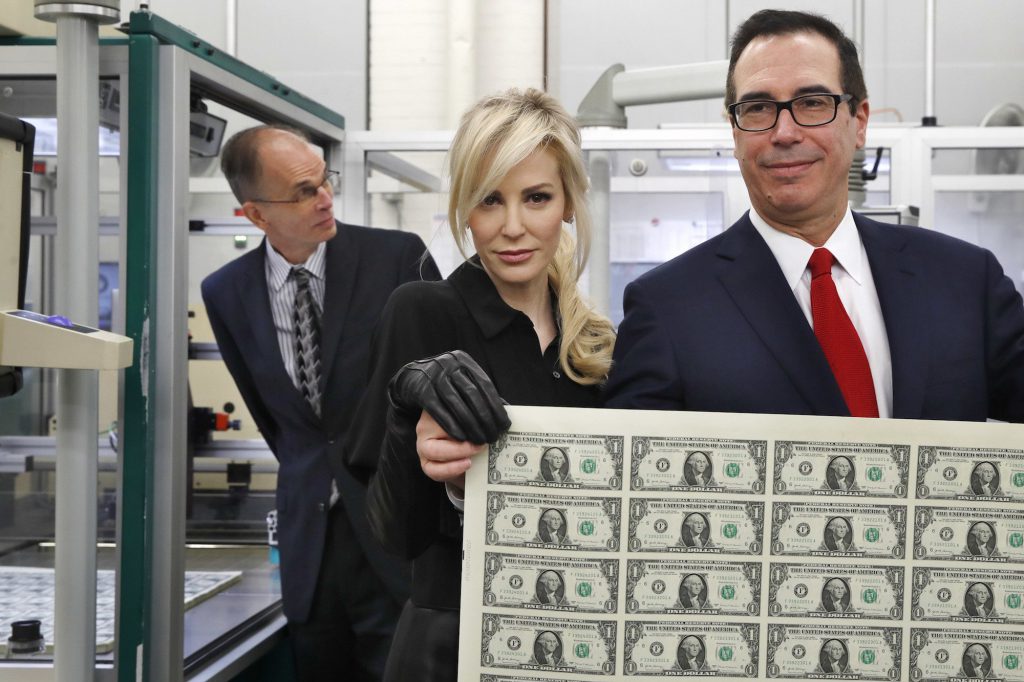
Source: AP/Jacquelyn Martin via Garber.
Continue reading
The Real Adrenaline Shot? Kansas since the End of the Brownback Experiment
Kansas employment nosedived in June, and has bounced back since the Brownback tax cut was rolled back. Kansas employment is catching up with Missouri after lagging. The Philadelphia Fed’s coincident and leading indices also point to a recovery in Kansas.
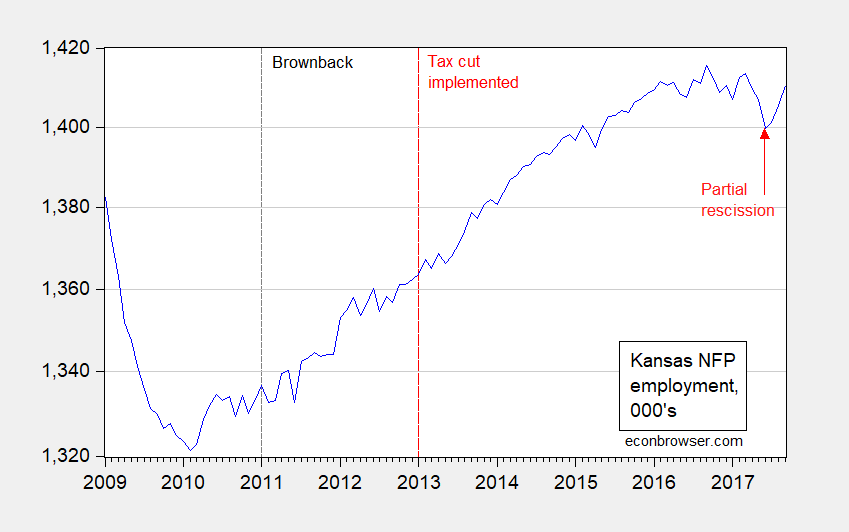
Figure 1: Nonfarm payroll employment in Kansas (blue), on log scale. Source: BLS.
CBO/JCT on Deficits and Debt under the Tax Cuts and Jobs Act
And resulting impending cuts to Medicare.
Per CBO letter released yesterday.
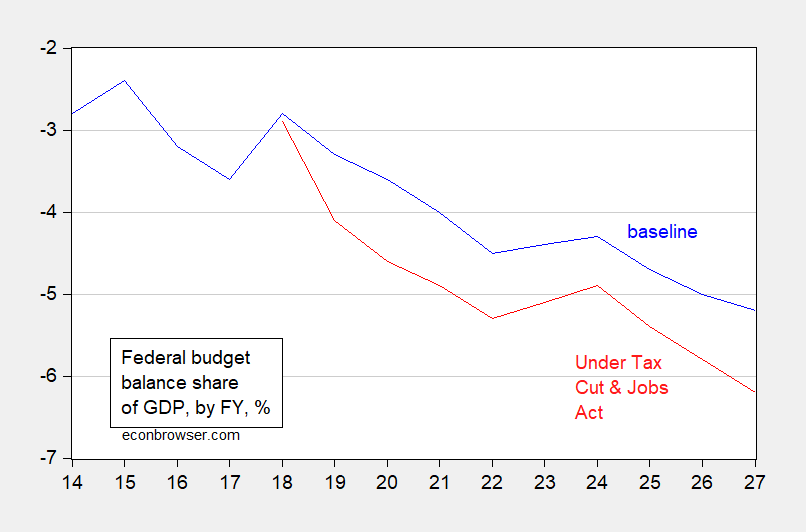
Figure 1: Federal budget balance to GDP, by FY, baseline (blue), and under Tax Cut and Jobs Act (red). Source: CBO.
Defining Crowding Out in an Open Economy
Gavin Ekins argues that it’s Time to Shoulder Aside “Crowding Out” As an Excuse Not to Do Tax Reform. From the introduction:
