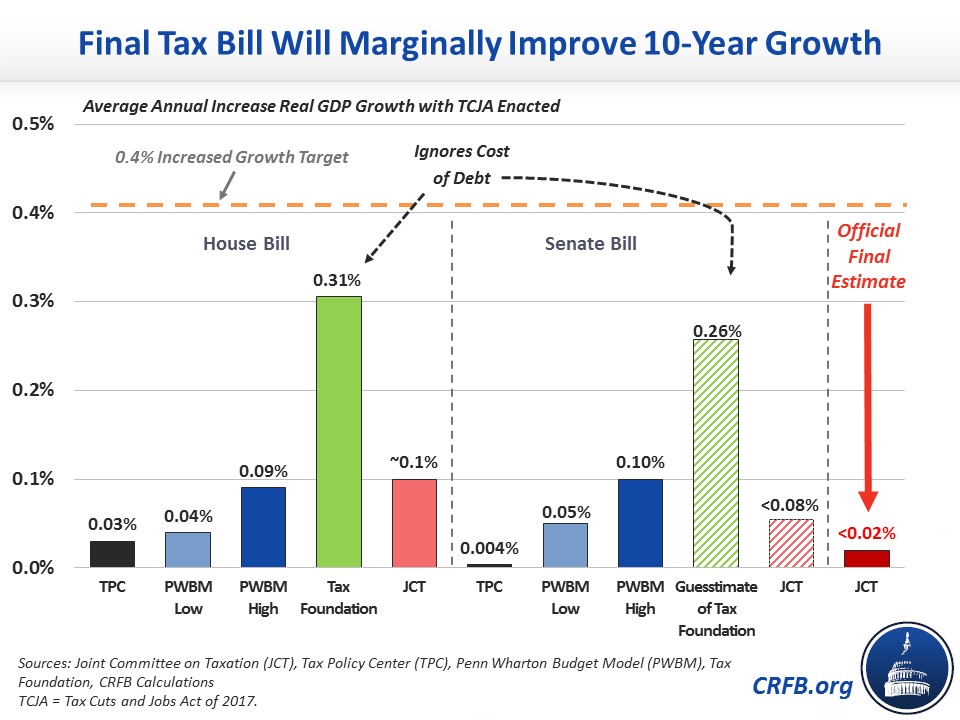
Never have so many simulations been ignored in favor of faith in tax cuts. Here’s the CRFB’s run down on growth impacts from the tax legislation as passed.
Category Archives: taxes
Imagine…107% Publicly Held Debt to GDP Ratio
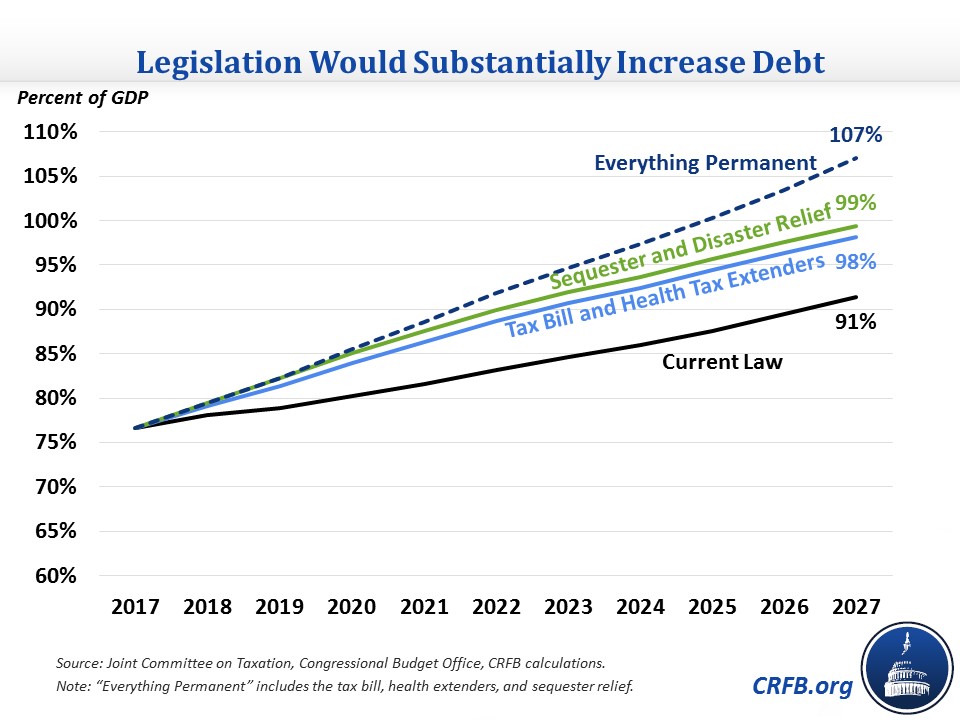
(Some) defenders of the Tax Cuts and Jobs Act as passed argue that tax cuts for households will be extended, rather than disappearing by 2027. What does that mean for debt?
Source: CRFB. Note: Differs from gross debt by netting out intra-Federal government holdings.
CRFB estimates FY2019 deficits will be $1.1 trillion.
Fortunately, the President has stated he will not sign a tax bill that he believes will increase the budget deficit.
Best Schematic Ever: Financial Frictions in Macro/Finance
I tire of hearing people who had one (or no) class in economics saying “the magic of the marketplace” will lead to the optimal outcome. What teaching finance has made me realize is that information problems are rife in many economic interactions. And one can’t be a student of currency crises without being even more convinced. The paper by Stijn Claessens and Ayhan Kose, “Macroeconomic Implications of Financial Frictions: A Survey” is a must-read for those who want to keep up with the literature. It has this fantastic schematic:
Views on Fiscal Stimulus Then and Now
Remember when critics wailed about the high cost/per job saved and low multipliers likely under the American Recovery and Reinvestment Act? The same set of people do not seem very bothered at all by the relatively small implied output impact of the TCJA produced by any of the reasonable modelers.
What Constitutes “an Economist”?
What prompted this question was seeing this release from Senator Portman (as well as this tweet) extolling the Tax Cuts and Jobs Act, appealing to the opinion of “137 economist”. Here’s the list:
Leontiev Lives! In Wisconsin
The MacIver Institute has released new projections of the impact of the Tax Cuts and Jobs Act on Wisconsin:
Continue reading
Term Papers Due this Friday
Where’s the Wisconsin Manufacturing Output Renaissance?
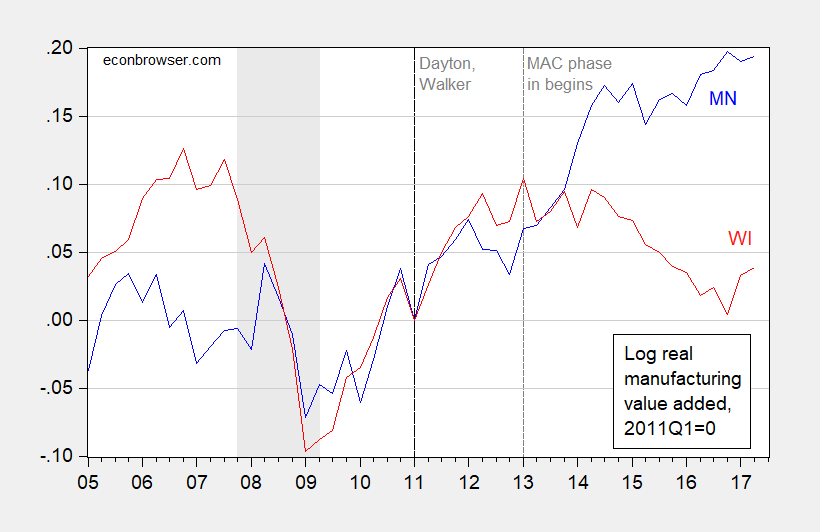
Employment in manufacturing may be estimated to be rising, but output seems to be trending sideways through 2nd quarter.
Figure 1: Log real manufacturing output in Minnesota (blue) and in Wisconsin (red), normalized to 2011Q1=0. NBER defined recession dates shaded gray. Vertical dashed line at 2013Q1 indicates beginning of Wisconsin Manufacturing and Agriculture Credit (MAC). Source: BEA, accessed 12/3/2017, NBER, and author’s calculations.
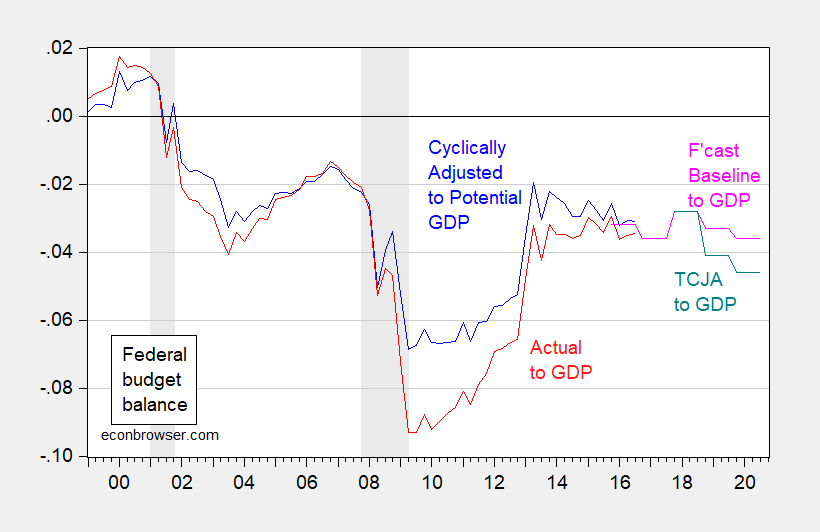
Prepare for Massive Deficits As Far As the Eye Can See
Signs are the putative Republican “deficit hawks” are about to sign away whatever integrity they had. What are the implications for the deficit going forward, keeping in mind the fact we are near or at full employment.
Figure 1: Federal budget balance without automatic stabilizers, as a share of potential GDP (blue), and Federal budget balance as share of actual GDP (red), and baseline forecast Federal budget balance from June CBO forecast (pink), and alternative under Senate budget bill (teal), both as share of projected GDP. NBER defined recession dates shaded gray. Source: CBO, Budget and Economic Outlook: An Update (June 2017), and CBO, Cost Estimate (November 2017), NBER, and author’s calculations.
Continue reading
No Trigger: The Umpire Strikes Back
The Senate parliamentarian ruled the trigger to prevent a revenue shortfall as unacceptable, thereby temporarily stymieing the bill.