GDPNow shows fast growth…
Category Archives: Uncategorized
“Liberation Day” Interpreted through the Lens of the Benchmark Revision
Pawel Skrzypczyński sends me the link to this graph:
Heritage Foundation Chief Economist: “Factors such as changes in exchange rates mean that foreign producers typically end up paying some (or most) of a tariff.”
That’s public finance and Heritage Chief Economist EJ Antoni. CBO (and just about everybody else):
Higher tariffs directly increase the cost of imported goods, raising prices for U.S. consumers and businesses. Because many imports are used as inputs in domestic production, higher tariffs also indirectly raise the costs of goods and services produced domestically using imports. In CBO’s assessment, foreign exporters will absorb 5 percent of the cost of the tariffs, slightly offsetting the import price increases faced by U.S. importers. In the near term, CBO anticipates, U.S. businesses will absorb 30 percent of the import price increases by reducing their profit margins; the remaining 70 percent will be passed through to consumers by raising prices. In addition, U.S. businesses that produce goods that compete with foreign imports will, in CBO’s assessment, increase their prices because of the decline in competition from abroad and the increased demand for tariff-free domestic goods. Those price increases are estimated to fully offset the 30 percent of price increases absorbed by U.S. businesses that import goods, so the net effect of tariffs is to raise U.S. consumer prices by the full portion of the cost of the tariffs borne domestically (95 percent).2 In CBO’s projections, the new tariffs increase the price index for personal consumption expenditures by about 0.8 percentage points at the end of 2026 but have negligible additional effects in 2027 and beyond.
Heritage Chief Economist Interprets Biden vs. Trump Employment Trends
EJ Antoni mangles the data:
Business Cycle Indicators
NBER BCDC indicators and alternatives:
A Levels Perspective on the Employment Situation Release
From today’s release, +133K v +66K Bloomberg consensus on NFP:
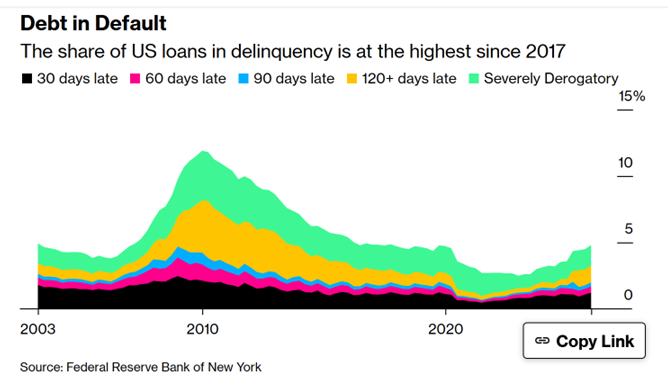
Households under Debt Stress: Two Pictures
Miran: No “…material inflation from tariffs.”
From CNBC:
If at 5pm ET, Trump Starts Posting about “Fake” Employment Numbers, Be Prepared
The White House receives embargoed BLS (and other) releases before the official release at 8:30am. If memory serves (and is still relevant), this is late afternoon the day before. So (if as before), Trump starts posting to get people to ignore the numbers, be prepared for a disappointing release.
Announced Job Layoffs Attributed to AI
In the Challenger, Gray and Christmas report for January is an interesting table, reporting the job losses attributed to each factor.
