Skip to content

Econbrowser

Analysis of current economic conditions and policy

Market Expectations on the Shutdown: 65% Ending on 18th or After

as of 10PM Eastern:

Continue reading →
This entry was posted on January 9, 2019 by Menzie Chinn.

“International Spillovers of Monetary Policy: Conventional Policy vs. Quantitative Easing”

That’s the title of a fascinating new paper with important policy implications.

Continue reading →
This entry was posted on January 9, 2019 by Menzie Chinn.

“A Third of a Century of Currency Expectations Data: The Carry Trade and the Risk Premium”

That’s the title of a new paper, coauthored with Jeffrey Frankel, using data extending back to August 1986.

Continue reading →
This entry was posted on January 8, 2019 by Menzie Chinn.

Jindal-nomics Illustrated

In response to my graph of Louisiana GDP, Manfred asks:
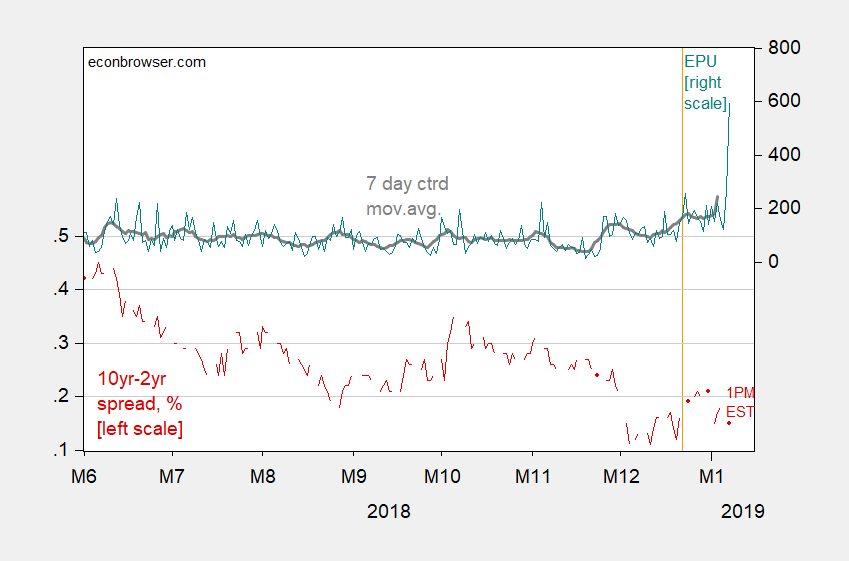
Continue reading →
This entry was posted on January 7, 2019 by Menzie Chinn.

Measured Uncertainty and Treasury Spreads, 1/7/19

Figure 1: 10 year-2 year Treasury spread, % (red), 1/7 observation at 1pm Eastern, and Economic Policy Uncertainty index (teal), and 7 day centered moving average (gray bold). Sources: Federal Reserve Board and policyuncertainty.com .
This entry was posted on January 7, 2019 by Menzie Chinn.

We Can Make Mexico Pay for the Wall

Just declare an International Emergency. From US Treasury,
U.S.C. annotated, Title 50. War and National Defense Chapter 35. International Emergency Economic Powers :

Continue reading →
This entry was posted on January 6, 2019 by Menzie Chinn.

Treasury Spreads and Measured Policy Uncertainty

Do they matter?

Continue reading →
This entry was posted on January 5, 2019 by Menzie Chinn.

Employment Estimates in the Run-up to the 2001 Recession

Continue reading →

This entry was posted on January 4, 2019 by Menzie Chinn.

Employment Release: We Are Now Back to the 2016 Stochastic Trend

Continue reading →

This entry was posted on January 4, 2019 by Menzie Chinn.

Louisiana’s Economic Progress since 2005

It’s striking. GDP correlates with oil in recent years, but not always, so why didn’t the magic of Jindalnomics work?

Continue reading →
This entry was posted on January 4, 2019 by Menzie Chinn.

Post navigation

← Older posts
Newer posts →

Authors

James D. Hamilton is Professor of Economics at the University of California, San Diego

Menzie Chinn is Professor of Public Affairs and Economics at the University of Wisconsin, Madison

Folow us on Twitter

  • James Hamilton
  • Menzie Chinn

Recent Posts

  • What If the Supreme Court Strikes down the IEEPA Tariffs
  • An Interesting Correlation: Heavy Truck Sales Growth as Recession Indicator
  • Sometimes I Think Trump Is Determined to Push the US into Recession: Heavy Truck Tariff Edition
  • Twenty Two Days in October
  • Delaying Employment Situation Release, CPI Release Next?

Categories

Archives

Current Indicators

Econbrowser faces the data: (since Apr 30,2025)

Econbrowser recession indicator index: 11.7 (describes  2025:Q1)

The most recent U.S. recession began in 2020:Q1 and ended in 2020:Q2

Proudly powered by WordPress