The Extreme Supply-Sider one in Topeka, that is. Josh Barro notes how tax cuts failed to result in entrepreneurial renaissance that would result in revenue increases; Wonkblog further observes (I did before) that employment growth has collapsed utterly and completely. Paul Krugman has dissected the social dynamics underpinning the adherence to patently unsupported ideas, but it is always useful to reiterate the facts of the case.
Kansas is doing so poorly in terms of private employment growth since 2011M01 — the beginning of Governor Brownback’s administration — that it rivals in (poor) performance Wisconsin [1].
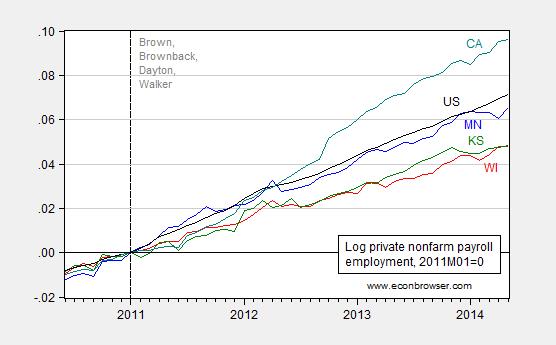
Figure 1: Log private nonfarm payroll employment for Wisconsin (red), Minnesota (blue), California (teal), Kansas (green) and the US (black), all seasonally adjusted, 2011M01=0. Vertical dashed line at beginning of terms for indicated governors. Source: BLS, and author’s calculations.
It turns out that broader measures of economic activity confirm the collapse in growth. The recently released Philadelphia Fed coincident index shows May activity lower than that in January of the year. This means the cumulative growth gap (from 2011M01) between national activity and Kansas has widened to 2.8% (log terms).
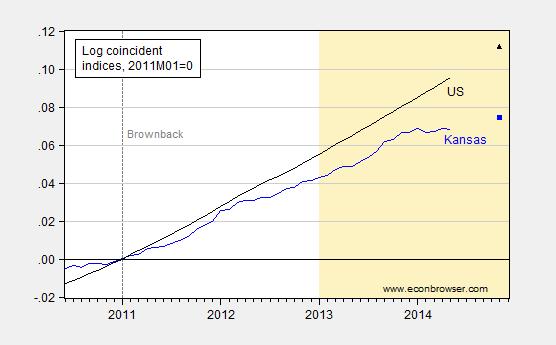
Figure 2: Log coincident indices for Kansas (blue) and the US (black), seasonally adjusted, 2011M01=0. Implied levels from leading indices for Kansas (blue square) and US (black triangle) for 2014M11. Dashed lines at 2011M01 (beginning of Brownback administration). Tan shading denotes period that tax cuts apply to. Source: Philadelphia Federal Reserve May releases for coincident indices and leading indices, author’s calculations.
Forward looking indicators from the Philadelphia Fed indicate that over the next six months, the gap will widen — to 3.8% (Figure 2). Figure 3 depicts where Kansas sits in the distribution of state six month growth rates (not annualized). The wisdom of Moody’s decision to downgrade Kansas government bonds in April seems to have been borne out. [3]
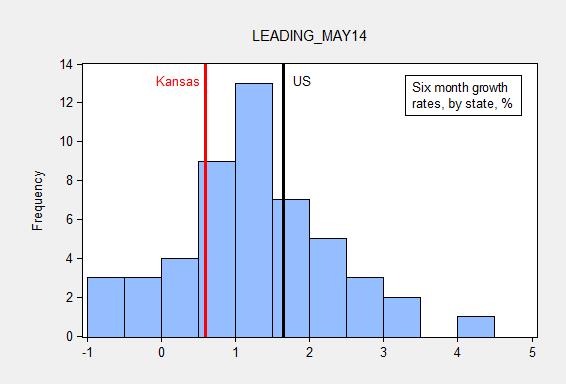
Figure 3: Frequency distribution of six month non-annualized growth rates. Solid red line at Kansas growth rate; solid black line at US growth rate. Source: Philadelphia Fed leading indices, May release.
Kansas sits in the bottom quarter of the distribution. The gap between the US and Kansas non-annualized six month growth is over a percentage point. The corresponding gap over the entire period which the Philadelphia Fed has been tabulating the coincident indices is about a quarter of a percentage point (this is essentially a state-specific “fixed effect”). (Note: one cannot appeal to antediluvian views on the negative impact of minorities on growth, as in this comment, since Kansas is relatively homogeneous.)
Concluding thoughts: After three years of an experiment in ALEC-Laffernomics, Kansas lags the US economy significantly. This should be no surprise to anyone. Over thirty years ago, I interviewed Arthur Laffer for the Harvard International Review about the supply-side scenario. I was skeptical then. I see no reason, from the experience of Kansas, to be any less skeptical now (See this post for a statistical analysis, and links to more comprehensive empirical analyses).
Addendum, 5:50PM Pacific: Bruce Hall, who previously asserted Wisconsin’s negative performance with respect to Minnesota was partly due to the higher minority population in Wisconsin, now asserts California’s outperformance with respect to Kansas is comparable ‘to an F student who raises his grade to a C to an A student who just “plods along.”’, where Kansas is the A student because its government is “well run”.
I have calculated the log ratio of Kansas to California coincident index, taken the first difference and multiplied by 12 (so the coefficients are interpretable as impact on annual growth rates) regressed it on a constant, time trend, and a dummy that takes on a value of one when Governor Brownback comes into office. The time trend thus accounts for the alleged poorly run policies of California. Here are the results:
Δz = –0.020 + 0.00004×time – 0.016×BrownbackDummy
Adj-R2 = 0.02, SER = 0.03. Bold face entries denote significance at the 5% MSL.
The results indicate that relative annual growth is 1.6 percentage points slower under Governor Brownback.
It still hasn’t sunk in to the Republican rank and file. They obviously vote on inertia.
No, you need to understand why republican economics exists.
It’s not for the sake of economic growth it’s to transfer wealth to the rich.
Now as for why the average citizens go for it, it’s wedge issues, racial dog whistles, and social issues based on religion, Are all designed to manipulate the poor and middle class whites that make up the GOP into voting against their own interest.
Before 1964, whites were very supportive of social programs and the such, because they viewed the gains as going to whites. This was how the new deal coalition held.
When the Democrats tried to extend such benefits to non-whites, the GOP used that as a.wedge claiming that these “welfare” programs were taking from whites to give to non-whites, of course they used coded racial appeals to communicate such things, they didn’t say it overtly, but they utlization these coded appeals to foment racial divisions between whites and non-whites and drive whites against the very programs they had previously supported.
Supply-side effects occur historically after the Long Wave peak (peak rate of change of increase in commodities prices and price inflation), during a period of falling nominal interest rates and resulting reflationary effects to asset prices and growth of credit until debt to wages and GDP reaches a cumulative differential order of exponential scale, i.e., the jubilee threshold, at which point a financial crisis occurs coincident with the onset of the debt-deflationary regime and Schumpeterian depression of the Long Wave Trough.
Historically, the crisis at the onset of the debt-deflationary regime clears the decks of excess debt to wages and GDP, permitting a transition to a demand-side regime to commence. However, the US, UK, and EZ TBTE banks printing themselves, via their central banks, trillions to bail their balance sheets and to achieve reporting dubious book entry profits without reducing loans and overall systemic debt to wages and GDP forestalled, or prevented, the debt-deflationary clearing of the decks and encouraged public debt to soar to wages and GDP (now similarly at the jubilee threshold that prohibits further growth of public debt to GDP).
The unprecedented bailout of the TBTE banks, their equity holders, and creditors again encouraged non-productive leveraged financial speculation, bubbles, and increasing systemic risk, creating a sense of complacency that the crisis was avoided once and for all, while ensuring the inevitability of the next financial and economic crisis, albeit at a larger scale to wages, GDP, and gov’t receipts.
The TBTE bank bailout and resulting larger financial bubble as a share of wages, GDP, and gov’t receipts virtually ensures that the next crisis will be larger, more destructive, and risk complete loss of credibility and legitimacy of eCONomists, Wall St., TBTE banks, the Fed, CEOs, rentier-captured DC politicians, and financial mass-media apologists and shills for Wall St. and the rentiers, who are the primary beneficiaries of bubbles and the neo-feudal, parasitic system of rentier extraction of surplus labor product, profits, and gov’t receipts in perpetuity.
None of this, of course, is lost on the rentier-parasitic Power Elite top 0.01-0.1%, the TBTE Anglo-American and European bankster oligarchs, their facilitators at the Fed, BOE, and ECB, and their establishment eCONomists intellectual apologists and enablers.
“All along the watchtower . . . the hour is getting late . . . “
Sigh…. Growth occurs for many reasons not related to welfare programs and government dumping of cash and creation of huge debt maintenance. But I do like your comparison of Kansas to California which shows that the recent growth rate of an abysmally run state exceeds that of a well-run state. Sort of like comparing an F student who raises his grade to a C to an A student who just “plods along.”
We really can’t be that naive, can we?
Kansas is the A student? lol.
If I was born and raised in Kansas, would my goal be to attend the University of Kansas and work in Wichita?
Maybe, it would be to attend CU-Boulder, hang out with the affluent, get a job at Denver’s “Wall Street of the West,” or Colorado’s Silicon Valley: The Denver Tech Center, or start a business, where people earn more than a Social Security check?
Paul Krugman on his Nobel Prize paper: “Today, 60 million people live along a narrow stretch of the East Coast. Those 60 million people aren’t there because of the scenery; each of them is there because the other 60 million people are also there.”
Statistical issues…..as with most macroblogging, we have more or less an observation, or say CA vs. KA. Oooo, 2 points, sorry. Then we make inferences. Did it work or not? Have to repeat about 100 X to get some reasonable answer to that question. This is just clear macroblog bias, picking a couple of points and assuming there is truth. Look at the IMF having to appologize for being wrong on England. Why? Were they wrong, or just the coin came up heads instead of tails? Silly.
pete: I didn’t do the 50 states comparison because…I’d already done it — as referenced in the post. Please consult this post. That’s not quite 100, but given your standard, one would never write anything. Maybe that is what you would prefer.
IMF apologize to the UK? Edify yourself, stop reading the talking points, and start reading a real macroeconomist.
(And this from a person who writes “Changing transfers is neither contractionary or expansionary.” Yeesh)
Lagarde’s apology:
http://www.bloomberg.com/news/2014-06-08/lagarde-says-imf-got-it-wrong-on-rallying-u-k-economy.html
I have no wish to justify the economic policies of Gov. Brownback, or the Republicans in Kansas. But as I am finding with the statistical analysis of temperature data, really examining the counter-factual isn’t easy. Wheat has fallen on the CBOT from 700 to about 565 over the course of the year. It’s not a trivial estimate to infer Kansas cattle prices, but they seem to have slightly declined over the year. Both hog and cattle inventory in Kansas are down over the year, according to the NASS reports. Corn prices have fallen from around 525.00 cents per bushel to 422,25 cents per bushel. Sorghum prices have fallen from 236.78 dollars per metric ton to 221.01 dollars per metric ton as of May. Transportation services demand for the U.S.A. seems to be only mildly growing, so Kansas transportation sales may not have been that great. Food processing employment nationally is only up about 5,000 from May 2013 to May 2014, according to the BLS data. The GAMA statistics on aircraft sales (at http://www.gama.aero/files/2013_GAMA_Databook-LowRes-02192014.pdf) show a recovery for 2013 for the entire aircraft market, but certainly that could have been cut into by the cold weather of the 1st quarter for Kansas. I would be delighted to see Koch Industries go bankrupt, but this hasn’t happened yet, and it is difficult to infer their revenues, since they do not release quarterly reports as a privately owned company. (Their “Fact Sheets”, etc., tell about their market presence, but do not provide any significant time series statistical data to use to examine how they are doing in 2014 relative to 2013.) All this would seem to indicate that the Kansas tax base has not grown significantly, and might not have grown so under more sensible policies, either.
Julian Silk: As a matter of record:
Food grains prices approx. 20% below Jan 2014 five-year peak, but still equal to mid-2013 levels; see USDA NASS
Meat animal prices hit a peak earlier in 2014; see USDA NASS
Durable manufacturing equipment employment (nsa) did fall in December, but as of April (past the coldest weather), has not recovered to October 2013 (before the winter); see BLS via FRED.
So the agricultural sector performance (arguably largely exogenously determined at this frequency) doesn’t seem to be a good explanation for lagging output, tax revenues. On the other hand, it’s arguable that transportation manufacturing is lagging, hence depressing tax revenues. However, weren’t the tax cuts aimed at resurrecting the economy by encouraging businesses. That’s certainly in the Governor Brownback’s strategic plan?
Could it be that output has stagnated because of the 3% decline in government employment in Kansas since January 2011?
I don’t disagree with these arguments, including the negative effect of government employment. What is being stated here is correct, and I am not doubting it. But I would just put it in statistical terms:
Tax revenues = t * TB, where TB is the Tax Base, and t is the tax rate.
t has fallen, as have government spending, etc. TB has risen, but poorly. and it would seem in terms of an estimate:
TB(predicted) – 2* se(prediction) < TB(actual) << TB(predicted) + 2*se(predicted)
In daily life, the conservatives who want smaller government as a religious belief, immune to any factual argument, basically state that the cuts in government were never intended to raise revenues the first year. It's always supposed to happen in some indefinite future, possibly the afterlife. To the extent that any factual evidence can be mustered against these arguments, it would appear that TB(actual) << TB(predicted) – 2*se(predicted). Then it is conceivable that you would be able to talk to the most heretical.
In the case of transportation equipment, the argument would be that you could only hope for a redistribution of production with tax cuts in a falling aggregate amount, like shifting water from one puddle to another in a shrinking lake. You would then have the statement that transportation spending is falling so much because of high gasoline prices (all due to President Obama's awful policies, including the ethanol mandate), etc., that this could not have been predicted. I agree this makes no sense, but you always get shifting the argument when the original premises fail.
Until you have falls in the tax base significant enough, in a non-statistical, political sense, that conservative Republican legislators lose their seats because of them, none of these arguments will change. My hope is that you would be able to get the information to put it in statistical terms, so that it could be taught in a classroom, without comment.
Menzie’s article demostrates both his ignorance of supply side economics and his weak reading comprehension.
First his ignorance of supply side economics – never does Menzie mention the Laffer curve. For a tax system to have a supply side effect it must impact those taxes that are on the disincentive side of the curve. Menzie either is ignorant of this aspect of supply side economics or he is disingenuous by intentionally ignoring it.
That brings us to Menzie’s weak readin comprehension. Barro was very clear in his analysis of the Kansas tax cuts but Menzie did not address his analysis at all. It is cleear from Barro that Kansas has implemented tax cuts that have a negative supply side effect. Unlike the demand side theories (Keynesian and monetarist) supply side economists do not believe that all tax cuts and all monetary expansions are the same. Digging holes and then covering them up do not generate production, employment, nor wealth. When tax cuts are implemented (such as the first Bush Keynesian tax cut) that do not impact production or, as in the case of Kansas, actually reduce tax revenue without generating additional supply through production they are not supply side tax cuts.
Supply side theory requires much deeper thinking than the demand side mercantilist thinking. Mercantilism is based on emotional feel-good economics founded in illusion. Rather than disproving supply side economics the experience in Kansas, Illinois, Californis, and New York prove supply side theory, but only for those who do not settle for superficial thinking.
I encourage you to read Barro’s article to better understand economics.
To make the point even more clear, the Laffer Curve says that at tax rates of 0% you get zero revenue. Josh Barro’s piece says Kansas applies a 0% tax rate to certain types of income. Guess what Laffer would expect the revenue to be.
So Brownback was not engaged in a supply-side effort? If that’s the case, there is really no economic justification for the tax cut. It amounts to nothing more than an undermining the states fiscal position. That’s good to know.
So, Ricardo, is it you contention that Brownback knew he was not engaged in a supply-side effort? Was he operating out of ignorance or was his thinking more Straussian?
Also, I’d like a bit more clarity on the whole incentive/disincentive business. I understand that revenue is sensitive to the side of the curve one is on, but are you saying that supply-side incentives don’t apply at low tax rates?
banana, it is hard to get a valid response from guys like ricardo, who are wed to an ideology no matter what the facts and data show. he is like a broken clock, right twice a day and completely wrong the other 99.99% of the time!
can we get NJ added to this map?
Also say one of its neighbors in PA or NY as a comparison.
NJ is in the middle of phasing in state corporate tax cuts over a multi year period, and has initiated a series of very large tax incentive programs for job creation.
I’m not sure how comparable NJ tax policy has been to WI and KS, but it would appear to be similar, and be yielding similar results.
Being in Wisconsin, the implications of this for Scott Walker’s campaigning is of interest to me. The last poll number I saw, indicated that 51% of Wisconsinites still considered Wisconsin’s economic performance above average. By most measures we would have to say it is below average and has been for awhile. Will the voters keep voting against the majority economic interests?
Thanks Dr. Chinn.
Unemployment rates, BLS, May 2014
Kansas: 4.8% (13th from top)
Wisconsin: 5.7% (23rd)
California: 7.6% (47th)
http://www.bls.gov/web/laus/laumstrk.htm
Careful, Steven. I pointed that out in the previous tirade against Wisconsin and Kansas and got mocked for it. But here is some data that was just released for 2013 that show California’s GDP growth of 2.0% significantly outpacing Kansas’ growth of 1.9%. I keep thinking that when you are at the bottom of the ladder it is easier to go up than when you are near the top, but I guess that’s not the case.
http://www.bea.gov/newsreleases/regional/gdp_state/2014/gsp0614.htm
What is conveniently disregarded is the longer term results of policies within a state. California has been blessed with all manner of natural resources and great climate, but has managed to decimate [not quite annihilate] its agriculture through terrible water management policies. It has turned its back on expanding its oil and natural gas resources. It has made itself a politically-correct refuge for all manner of non-productive citizens and illegals. But somehow Kansas is “suffering”. Not!
Bruce Hall: I am thankful that you didn’t bring up minorities (but, true to form, you brought up “illegals” — you never cease to disappoint). Nonetheless, you are comparing growth rates going from 2012 to 2013, and we are now in the 2nd half of 2014. Gee, I wonder if we have a more up to date tracking on economic activity. What could that be, what could that be…oh, it’s the Philadelphia Fed’s coincident indicators– exactly the thing I have been highlighting. And if you were to consult the documentation for these indices, you would find out that their trends are calibrated to match real GSP over time.
So, let me re-draw your attention to Figure 2. What is the Kansas trend relative to the United States? So referring to 2013 growth rates relative to 2012 is, while not wrong, pretty backward looking. Which in this context I do not find surprising.
Menzie, I know it is not politically correct to point out that certain groups are less educated and less productive and less employed, but this is supposed to be a discussion regarding economics and to disregard the impact of those groups on specific states/regions is a bit self-deluding. California is fortunate to have the “Silicon Valley” and a relatively large Asian minority to offset some the effect of poorer performing groups. http://nces.ed.gov/programs/digest/d13/tables/dt13_104.20.asp
And yes, the data released on June 11 does compare 2013 to 2012, but so what? By nearly all measures, Kansas has been and is outperforming California… log chart notwithstanding. You are well aware that “blips” happen all the time… such as a negative 2.9% national GDP rate for the first quarter 2014 despite Keynesian pump priming through virtually giving away money by the Fed.
I will grant you that Kansas is having less tax revenues than projected for the first 6 months of this year. Michigan went through a similar process and is enjoying a surplus now. There are few economic switches that produce both short-term and long-term results. We have enjoyed the results of the President’s policies with an agonizingly slow 5-year recovery while building a massive national debt. Sure, it was Bush’s fault. It will be Bush’s fault until Hillary finishes her second term. Yes, government can prime the pump, but if the pump is faulty you’re going to do a lot of priming for a long time.
Steve Kopits: Please, please, please, consult an econometrics textbook, or at least Wikipedia for the term, individual-specific “fixed effects”. From 1976M01 (beginning of monthly state-level data) to 2010M12 (just before Brownback, Walker, Brown), Kansas’s unemployment rate fixed effect was -1.64 ppts, Wisconsin’s -0.86, and California +0.91 (relative to US). So if you are going to compare the efficacy of policies on the unemployment rate (personally I prefer employment levels or economic activity), then at the very minimum you should account for these fixed effects.
I need to consult an econometrics textbook to quote BLS statistics?
I checked the statistics because I knew that Kansas has benefitted in part from the shale revolution and is an ag state as well. Therefore, I suspected that the unemployment rate there had to be pretty low. And it is. The oil and gas producing states have done well, as you yourself have pointed out. (North Dakota has by far the nation’s lowest unemployment rate.) However, expectations for Kansas hydrocarbon production have fizzled a bit. Still, I think a 4.8% unemployment rate is really very good. I don’t know what exactly your metric of ‘full employment’ should be, but Kansas is pretty close.
I am all for low taxes, but my preference is value for money. Bad fiscal policy is not the same as value for money, and that’s as true in Kansas as anywhere else. There’s more to it than just ‘low taxes’ or ‘high taxes’. Having said that, governments do not have an incentive to maximize sustainable prosperity. I have written about the FAA before; I will write about it again. If you want to maximize growth, pay for it. (And let me concede up front that I don’t know what tax rate is compatible with that; nor do I care.)
Having said that, in many places, taxes are not competitive. Philadelphia, for example, wanted a $2/pack tax increase on cigarettes to fund schools. The state has turned them down. Cities like Philadelphia, Baltimore, DC and Detroit have to understand that they have to compete for residents. At some point, your ability to tax is capped, and you have to make do with a fixed level of taxes. The more you raise, the more you erode your tax base. Philadelphia is a corrupt, incompetent cesspool. Why would a non-Philly PA resident want to subsidize that? It’s time for Philadelphia, and cities and states like it, to understand that they are operating under constrained budgets and that they have to produce better value for money to retain or regain political legitimacy. And that will involve reduced long-tail obligations for retired public sector workers, a material reduction in the power of public sector unions, a big increase in charter schools, and paying market rather than prevailing wages, among other policy changes. They have to provide value for money, and they’re not doing it now–in significant part because the incentives are not aligned.
If we return to the BLS list, let’s see where some of the high tax or heavy union states are:
– New York 6.7% (37th)
– New Jersey (my home state): 6.8% (38th)
– Connecticut: 6.9% (41st)
– Oregon (give me a minimum wage!): 6.9% (41st, tie)
– DC, Illinois, Michigan: 7.5% (tie, 44th)
– Rhode Island: 8.2% (50th)
Now, unemployment rates are a function of many factors. But to tell me that California at 47th is a paragon of virtue and Kansas is a loser at 13th, well that defies imagination.
If you have specific policies for, say, Wisconsin, that you believe would increase employment or economic performance, let’s discuss them. But this Oh-see-Scott-Walker-is-a-bad-guy-stuff, well, I have no patience for that. Your state-level posts are essentially destructive, not constructive. It’s all about throwing grenades over the parapets. It is low quality stuff.
When you want to take the time to thoughtfully review some specific policies, weighing pros and cons, I am happy to consider those on their merits.
Steve Kopits: No, a monkey could cite BLS statistics. To understand what they mean requires context, and context in this case includes what the historical relationship between state specific unemployment rates and national rates is. Otherwise, we would always be running pooled time series cross section regressions instead of (sometimes) running fixed effects regressions.
Technically, perhaps slow moving fiscal or union membership variables pick up the fixed effects. However, if you make the comparison, and those variables do not pick up those fixed effects (e.g., structure of economy, demographics, etc.), you will adduce to your other explanatory variables those effects if those other variables are correlated with the fixed effects.
So, by all means, cite away. But, as in our previous discussion of chain weighted indices, it might perhaps possibly maybe behoove you to investigate the concept of fixed effects, and how one deals with them in statistical terms (one doesn’t have to necessarily do fixed effects estimation; diffs-in-diffs is another approach).
I’m sorry. I thought Figure 1 implied that you thought California was a well run state, and Kansas was a poorly run state. If that’s the case, let me disagree. Unemployment figures suggest that California is a very, very poorly run state; and Kansas is a pretty well run state.
But the economy in Kansas is going to be heavily influenced by agriculture, oil and gas on the margin. That’s true for the surrounding states as well. California’s economy has different drivers. Energy and ag producers–which are linked to the Chinese economy or fracking–have done well, until China entered some sort of quasi recession about a year ago. Now commodities producers–Brazil, Australia, Canada–have had some of the wind taken out of their sails, particularly in the last year. How have you accounted for this?
How have you accounted for the impact of low nat gas prices, which have tended to displace natural gas production around the country in favor of Marcellus production? (Production in Kansas continues to fall.) How have you accounted for flat oil prices and increasing E&P costs? (Oil production peaked there a year ago.) How have you accounted for flat oil prices and low nat gas prices on the manufacturing and coastal states, which tended to perform poorly when energy and commodity prices were high and rising?
How have you accounted for the existing level of unemployment? In 2010, unemployment in California was 12.4%; in Kansas, it was 7%. Now it’s 7.6% in California; 4.8% in Kansas. Do you think unemployment should have dropped 5 percentage points in Kansas, as it did in California? Is that reasonable? Tell me what unemployment rate in Kansas is consistent with it having kept up with the US. What is it? 4%? 3%? 2%? Is that easy to achieve? Should Kansas consider a 4.8% unemployment rate a failure of policy? Then what’s a success? Say, fifth place, 3.8%, tying it with Wyoming and South Dakota? Could Kansas close the gap to US performance with only a 1.2% decline the unemployment rate?
Did you take into account the impact of swine virus on Kansas? (http://fox4kc.com/2014/04/10/swine-virus-outbreak-affects-pork-industry-in-missouri-and-kansas/) How about declines in the cattle stock?
Why is Missouri worried about tax competition from Kansas, if it has no effect? Why is Missouri considering similar tax breaks?
Or maybe we should take a different approach. Why not explain the mechanism by which Brownback’s policies have changed the trajectory of the Kansas economy and the policies which should be instituted, and the magnitude of effect you anticipate. What do you think Kansas should do?
Steve Kopits: Well, as far as overall managerial efficiency goes, I have no particular opinion. But if you are asking me if slash-and-burn fiscal policies (cut taxes anti-progressively, cut spending commensurately) or balancing the budget using a combination of tax increases and spending restraint is better, I pick the latter (California).
You are right, there are many other factors, and had I time, I would collect up the economic indicators, and run a regression and determine the impact of each of the factors you mention. But I don’t, so let me just observe: according to the Kansas Department of Commerce (please verify for yourself), in 2012, a total of 3.9% of gross state product originated in agriculture. For mining (including oil and gas production), the share was a massive … 1.2%. And you are telling me that these factors dominate in the variation in Kansas economic activity? Well, maybe. Whatever is true, the “adrenaline shot” that Governor Brownback promised with the implementation of the 2013 tax cuts has not yet resulted in a closing of the gap with the rest of the country; rather it has occurred in a conjunction a widening of the gap between Kansas and the rest of the country.
Oil production peaked there a year ago.
In a pattern that’s similar to oil production in the US overall, Kansas oil production peaked in 2002 and has been rising since: http://www.kgs.ku.edu/PRS/petro/state.html
oops – that should have said “bottomed out in 2002”.
It’s fascinating to note that Kansas oil production bounced up in the early 80’s in a lagged fashion after the price of oil bounced up. Kansas oil production appears to be more price sensitive than that of the country as a whole!
I thought “demographics” was a no-no.
Bruce Hall: Demographics is fine. I just think bringing up bugaboos like high minority concentrations — or high “illegals” concentrations — causing slow growth should be based in fact. Or else high minority states like California would be growing slower than Kansas — which let me just tell you in per capita or total inflation adjusted terms is not the case (on a five or ten year trend basis).
Alright, let’s define “slash and burn” in Kansas.
Tax Revenues ($ millions, FY):
2012: 6,610
2013: 6,245, +1.4% over previous year
2014: 5,873, -6.0%
Expenditures:
2012: 6,098
2013: 6,166, +1.1%
2014: 5,964, -3.3%
I’m not sure I would define -3.3% as ‘slash and burn’, but it’s surely a marked step towards smaller government.
I’d note that Barro writes:
‘In 2012, Kansas lawmakers passed a large and rather unusual income tax cut. It was expected to reduce state tax revenue by more than 10 percent, and Gov. Sam Brownback said it would create “tens of thousands of jobs.”’
This 10% number is not evident in any budget I could find. Tax revenues for FY 14 are projected down -6%, total revenues are projected down -4.3%. There is no 10% figure in the FY 13 or 14 budgets that I saw. And FY 13 was up on FY 12 on both the revenue and expense side. I think sizing tax changes is always going to be a challenge; it is certainly possible the administration there under-estimated the revenue impact of tax changes, even though a decline of $372 million was budgeted. They may have to re-visit this issue.
Creating “ten of thousands of jobs” in a state with a labor force of 1.5 million and unemployment of 4.8% is no mean feat. One percent of the labor force is about 15,000 jobs, and labor force is declining by 0.5% per year. Maybe you could push the unemployment rate down another percent or so. But the employment to population ratio in Kansas is already much higher than its comp group: 64.5 percent vs 59.7% in MO or 56.4% in California. So that’s a net of about another 15,000 or so jobs max that the economy there can take, if I believe what I see. That would bring unemployment a year hence to about 3.3% (allowing for a shrinking labor force), which would make Kansas tied for second in the unemployment rate with Vermont. Put a fork in it: Kansas is done for employment gains at that point, and frankly may be just about at full employment right now. The “ten of thousands of jobs” is hyperbole, at least on a net basis.
At the same time, Kansas is highly dependent on a few companies. Sprint, for example, employs 8000 people–half a percentage point of employment all by itself. So you want to be darn sure that your key employers stay happy, and you know what their priorities (services vs low taxes) are.
For a small state like Kansas, attracting key employers is very important. But at this stage, I think a larger employer would have significant reservations about opening a major facility there. I would guess some HR diligence would suggest that hiring people in the hundreds in Kansas, particularly those with skills, could be potentially quite challenging and expensive. Kansas is doing well. That’s what the numbers indicate, and they also suggest that the state will struggle to attract significant new inward investment from non-incumbent employers.
As for reducing the budget for its own sake: I am a small government guy, and I have to admit to being impressed by a governor will to put his money where his mouth is. A down-payment of 3.3% is a real commitment. Let’s see where it goes over time. Let Barro and Krugman scream all they like.
At the same time, I think Kansas should use its period of prosperity to possibly upgrade its capabilities to increase its appeal to higher tech industries. How one does that is a matter of understanding the situation on the ground, which I can’t claim to do. Let’s see where smaller government takes Kansas. I have no problem positioning Kansas as The State for People who Work. If you want to live on social insurance, California is happy to take you, and the weather is better there, too. And of course, high unemployment represents good governance as well. We know because Menzie told us so.
http://www.washingtonpost.com/blogs/wonkblog/wp/2014/06/27/tax-cuts-in-kansas-have-cost-the-state-money-and-jobs/
http://budget.ks.gov/publications/FY2014/FY2014_Comparison_Report.pdf
http://www.kansascommerce.com/index.aspx?NID=438
Steve Kopits: Look to page 13 of the FY2014 Comparison Report. FY 2014 (which just ended) is 3.1% lower than FY2013; FY2015 will be 0.6% lower than FY2013. But what is more interesting is the real spending trend; since the CPI-Midwest rose 1.6% (y/y through May), then real spending fell 4.7%. Even more telling is that nominal economic activity probably rose about 3.6% through May (change in Philadelphia Fed coincident index plus change in CPI-Midwest). So that is a drastic fall in spending, proportionately.
More important is the need for government services relative to what is being spent. Poverty rose from 13.6 to 14.0% going from 2010 to 2012. [1] He cut welfare rolls, increased restrictions on access to SNAP. He also declined expansion of Medicaid, which would have had zero budgetary cost to the state in initial years, which will mean 100,000 people who otherwise would have been covered will not be as of 2016 [2]
Steve Kopits: I didn’t say we should take Medicaid away from the employed. But you wrote (and I quote verbatim):
I thought it only fair to set the record straight. You want to believe all people on assistance are the undeserving poor, and even if you occasionally make caveats, this comes out clearly in your writings (why else capitalize?).
I meet minimum wage workers every day — each time I go to a fast food restaurant, my guess is that there is at least a 50% probability that the person serving me is at minimum wage. Maybe you don’t have to rub shoulders with the likes of such in the rarified locales you frequent.
“You want to believe all people on assistance are the undeserving poor”
There’s always going to be a tension in policy between support and accountability; between helping out and wasting money; and between compassion and underwriting anti-social behavior; between self-reliance and dependence. It’s a question of where you draw the line, and the voters of Kansas have elected to draw it tighter.
To my mind, neither I nor anyone else has a God-given right to the income or assets of others. If the voters decide to provide more, that’s their prerogative, as is their prerogative to provide less. I do, however, believe that the first and foremost role of government is to provide sustainable prosperity for the community as a whole, not for any given member of the community.
To my mind, neither I nor anyone else has a God-given right to the income or assets of others.
Wow. Really? Not even small children? How about veterans with serious injuries or service related disabilities?
Brownback appears to have made a statement about the strategy and position of Kansas: The State for People who Work.
The employment to population ratio there is 6 percentage points higher than the national average and the unemployment rate is among the very best. You see that as failure; I see that as success.
You’re claiming that the governor is cutting payments for SNAP and Medicaid. These are programs for People Who Do Not Work. I hardly see how cutting these programs would hurt the state’s competitiveness. Again, you see California’s comparative advantage as providing services to those not working. Let Kansas have its strategy; California can also have its own.
Whether due to Brownback or other factors, Kansas is doing very well. Six more people in every hundred are working there than in California. That’s a phenomenal gap.
So, that’s where we differ in ideology. For me, the purpose of government is first and foremost to provide prosperity and common services. You believe the principle role of government is to redistribute from the have’s to the have not’s. Those are enduring differences of values. You’re an egalitarian; I’m a classical liberal, first and foremost.
Steve Kopits: You write Medicaid and SNAP are for…
I’ll remember that the next time I meet a minimum wage worker who is on SNAP. I guess it’s their own fault that they didn’t hold out for a higher paying job. If only there were poor-houses! Those kids — they should be in the factories, too! They aren’t working…
Medicaid… only people who don’t work collect Medicaid?
Finally, you cite the point that Kansas has a employment to population ratio (not controlling for age distribution, etc.) that is 6 per 100 higher than California. Well, I tried to replicate that figure. I obtained the civilian employment figures from the BLS (May 2014 release), divided by the quadratic match interpolated annual population figures available through FRED (through 2013). I find that over the period 1976M01-2010M12, the average difference (also known as a fixed effect) for Kansas vs. California is 3.7 persons (Newey-West estimate of standard error = 0.25 ppts). The gap in 2013M12 is 4.3 — so if there’s a big jump in relative performance, it’s just barely statistically significant, and not economically large relative to the fixed effect.
It comes from the page you cited: ‘Economic Indicators’
http://www.kansascommerce.com/index.aspx?NID=438
Would you be happier if I said that Medicaid should only be taken away from people who don’t work? I doubt it.
And how many minimum wage people do you hang around with, anyway? If you really cared about these folks, you’d be a hell of a lot more innovative, flexible and thoughtful about your policy suggestions. You’d be looking a lot harder at policies beyond redistribution.
Steve Kopits: Thanks — those are ratios for 2012. Since we have 2013 employment figures, I can estimate the corresponding ratios for 2013. I extrapolate 2013 population using a ten year regression of log first differences of population to estimate for Kansas. I then calculate the employment ratio dividing the civilian employment figures from the household survey by the state resident population; for the US I divide the corresponding employment figure by the mid-month population. These figures don’t correspond to the those reported in the KS website (in fact I cannot replicate the KS figure using the data reported in the first table that reports employment and population, suggesting it is an adjusted figure). But when I calculate the employment ratios using the same procedures, I find the fixed effect for Kansas vs. US (for 1976M01-2010M12) is 3.05, HAC standard error 0.14; the 2013M01-M12 gap is 3.01. In fact the KS employment to population ratio is declining through 2013, the year that tax-cut-fans allege is when we should be examining.
How about Illinois? Also, your previous 50 state comparison (that you cite in response to Pete) finds no relationship, so blaming the poor growth on ALEC-approved policies has now ascribed a meaningful relationship where your prior analysis found none. As you found before, some do well, some don’t. In other words, it is complicated. This simplistic comparison doesn’t add much other than vitriol.
BananaGuard,
Brownback bought into the Republican myth of any tax cut will stimulate the economy. I can’t tell you what he was thinking but my guess is that he was simply ignorant of what he was doing, as were the other Republicans who passed the tax plans. Even Laffer has made the mistake of understanding his own curve.
Supply side growth comes from tax cuts when the tax rate is in the prohibitive range of the Laffer curve. You must not take this superficially. To better understand let me suggest you real Jude Wanniski’s book THE WAY THE WORLD WORKS.
Ricardo: Wow, Laffer does not understand Laffer.
Hmm, let me try this. It seems you don’t understand the Laffer curve. The curve itself pertains to tax revenue, and tax rate reductions in a neoclassical model (absent backward bending labor supply curves) will result in supply-side increases in economic activity even when on the left-hand side of the Laffer curve. It’s just that in this range of tax rates, the increase in activity is not sufficient to offset the decrease in tax revenue arising from the decreased tax rate. That’s how I understand a Laffer curve. And yes, I read (and survived) Wanniski’s book.
Clever choice of start year. The change in log-employment since 2011 is (unsurprisingly) larger in CA than KS. It is also larger in my home state, AZ, than KS. Missed entirely in your cherry picked analysis is the principal driver of this trend (hint: it has nothing to do with any public policy adopted in either CA or KS in 2011).
CA, like AZ, suffered a deep contraction during the recession – performing significantly worse than KS. Unsurprisingly, CA has enjoyed faster growth coming out of this pit. However, viewed from a longer timeframe, suddenly things aren’t looking so rosy for the golden state, at least vis a vis KS!
Nice try, though. One can draw whatever conclusions one wants if he picks his data carefully enough. That doesn’t make it so.
https://research.stlouisfed.org/fred2/graph/?chart_type=line&recession_bars=on&log_scales=&bgcolor=%23e1e9f0&graph_bgcolor=%23ffffff&fo=verdana&ts=12&tts=12&txtcolor=%23444444&show_legend=yes&show_axis_titles=yes&drp=0&cosd=2004-05-01%2C2004-05-01&coed=2014-05-01%2C2014-05-01&width=670&height=445&stacking=&range=Custom&mode=fred&id=KSNA%2CCANA&transformation=pc1&nd=&ost=-99999&oet=99999&scale=left&line_color=%234572a7&line_style=solid&lw=2&mark_type=none&mw=1&mma=0&fml=a&fgst=lin&fq=Monthly&fam=avg&vintage_date=&revision_date=
Glenn: Frankly speaking, I think your graph makes an excellent point for my case. I urge everyone to click on graph you provided. Note that from January 2010 through January 2011, growth rates in California and Kansas match — and are pretty close through February 2012. They then diverge, with California accelerating past Kansas. If the snapback is conditional on the depth of recession, why did it take until February 2012 for it to materialize? Inquiring minds would like to know.
I have plotted the Philly Fed coincident indices for Arizona and California. Peak to trough, California fell about 7.4% (log terms), while Arizona fell about 16%. Yet California has grown (cumulatively) faster since the the last peak. So, I’m further confused about your snapback argument.
Menzie,
Sorry, but I’m still whistling.
First, if we are talking about the effects of tax cuts, we have to get the time period right. The Kansas tax cuts started in 2013, and so you’re regression ought to set the dummy variable to start in Jan of 2013. It doesn’t really change the regression results, as you get a coefficient of -1.5% on the dummy variable (and it’s signficant), but this time period does matter for another important reason.
That reason is, of course, that the Obama Administration’s Taxmageddon started in Jan 2013. Taxmageddon includes
– expiration of the Bush tax cuts
– expiration of the payroll tax cut
– the AMT patch
– expiration of stimulus tax cut
– tax hikes from Obamacare
– implicit increases in marginal tax increases from Obamacare
– and others
We need to think about Taxmageddon since otherwise how do we explain the fact that economic activity seems to have been de-stimulated following the Kansas state income tax cuts, especially when standard economic theories would predict no change or a positive impact.
One way to see the effects of Taxmageddon is to run the same regression for a couple of neighboring states that are economically similar but did not execute the big tax cuts. If we run the regression for Iowa, we get a coefficient on the dummy variable (starting in Jan 2013) of -1.8% and it’s significant. If we run the regression on Nebraska, we get a significant -2.1% on the dummy variable. So Kansas with its tax cuts is actually been doing a bit better than its similar neighbors (but not all of them).
I seem to have heard somewhere that we need to consider the counterfactual in these matters. What would have happened to Kansas in the absence of the tax cuts? And, channeling Krugman, isn’t the problem with the Kansas tax cut that it wasn’t big enough?
Also, a comparison with California makes the effects look bigger than they really are. If I repeat the regression, but compare the US to California, then I get a significant coefficient on the dummy of -.8% for the US. California is doing significantly better than the country as a whole under Taxmageddon. We should really be comparing Kansas to the US to get a more realistic picture.
If we do that, we will see that the assertion in the post that “Kansas lags the US economy significantly” isn’t supported by the regression. If I run the regression for Kansas against the US rather than California, I get a dummy coefficient of -.7%, and it’s not significant. Nebraska against the US is -1.2%, and that’s not significant either. Only Iowa has a significant coefficient of -.9%.
Those numbers above set the dummy to start at Jan 2013. But if we start the dummy to start at jan 2011 when Gov Brownback comes into office, I get -0.4% on the dummy variable for Kansas and it’s not significant.
To Ricardo’s point, not all tax cuts are equal. Many conservatives/libertarians did not think the Kansas cuts were optimal. It would have been better to broaden the base for example and perhaps not provide the corporate pass through. But the evidence does not suggest, I think, that the tax cuts failed but rather that they were too small to resist being overwhelmed by broader economic forces.
Rick Stryker: I would expect nothing less of you. For me, it’s not all taxes. Spending was also reduced. In particular, real per student spending on education was reduced by 16.5% going from FY2008 to FY2014. In other words, implementation of the Brownback agenda started in 2011, not 2013. January 2013 is just the beginning of the new tax regime. And in any case, aren’t you a believer in rational expectations? If so, then forward looking agents should have started reacting in 2012 (and if you aren’t, I’d like to get you on virtual paper to that effect).
Menzie,
I don’t see the big reduction in spending that could account for Kansas. You mention education statistics over 2008-2014 but Brownback has been in office since Jan 2011. Take a look at Table 7 in the State Expenditure Report which compares spending among the states for the years 2011-2013. You can see that although total spending on elementary and secondary education declined a bit in Kansas, that is explained by the drop in Federal ARRA funds from 2011, which is a common decline for the states. If you just look at the state spending component on education in Kansas while Brownback has been in office, it’s pretty stable.
I do think that expectations of future policy changes affect decisions today. However, I wanted to focus on a time period in which the Kansas tax cuts and the Federal tax increases are aligned. We could also do your regression using a dummy starting in Jan 2011. If we do, the comparison between Kansas, Iowa, and Nebraska is even more stark. Comparing to California as you did originally, I get -1.6% on the dummy coefficient for Kansas as you did. For Nebraska, I get -2.4% and for Iowa -2.1%, both significant. Kansas’s performance has been relatively better than Iowa’s and Nebraska’s over Brownback’s full tenure in office, relative to California.
I already mentioned that if we run the regression for Kansas with respect to the US with a dummy set from jan 2011, we get -0.4% and it’s insignificant. If we do the same for Iowa, we get -1% and it’s significant. For Nebraska, the coefficient is -1.3% and it’s significant. So, by that measure, Kansas has not been doing significantly worse than the US in terms of growth of activity since Jan 2011 but Iowa and Nebraska have.
Illinois has raised income taxes significantly. Since January 2008, employment has dropped by 5% compared to only a 2% drop in Wisconsin.
Menzie,
Your lack of reading compehension is sometimes hilarious – “Laffer does not understand Laffer.” LOL. To most I do not need to point out that I said that Laffer does not totally understand the curve that was named after him.
It might be instructive to give a little history of the “Laffer” curve so that those who reason will understand. Art Laffer did not name the curve after himself. The curve was named after Laffer by Jude Wammiski. Laffer explained the concept, which is actualy as old as economics – Andrew Mellon consciously used it to create the prosperity of the 1920s. As Jude tells it, “I first watched Laffer scribble it on a cocktail napkin to demonstrate the idea for Vice President Dick Cheney, when Cheney was deputy chief-of-staff to President Gerald Ford in December 1974. Almost everything written has been wrong, in that reporters or critics of the Curve thought it showed an immediate response, where there would be no deficit increase in the 12 months following the cut. Laffer has not always been consistent and there have been times that he has made the mistake that Jude describes. Not all tax cuts are supply side tax cuts.
It will be educational to read all of Jude’s article on the Laffer curve here
If you wouild like a complete understanding of the supply side revolution of the late 1970s and 1980s that gave us the Reagan-Clinton prosperity read Brian Domitrovic’s ECONOCLASTS.
Ricardo: Let me quote exactly what you wrote:
Not “…Laffer does not totally understand the curve that was named after him.” If that is what you meant, you should have written it out. What else is the point of language? Any person reading that sentence would take the interpretation I took. I knew the story you allude to, but still did not know that is what you meant. Either you are very bad at communicating, or you are trying to rewrite what you said.
Julian Silk
Thank-you for attempting to bring real Kansas economic analysis into the discussion. As you noted the causes of its slow growth but good unemployment rate is not just fiscal policy by the state government, but uncontrollable factors which effect major contributors to the state economy.
To repeat and perhaps expand on some of your points.
Not only are wheat prices down severely, the Kansas spring wheat crop was quite poor. It is a double whammy of low price and low production.
Cattle numbers are down more than they have been for a half a century. This is some what countered by high meat prices, but than again prices for feed components are also quite high.
Since you seem to have a good reading of Kansas specific economy, could you, Julian, give further information on the other major economic sectors. For instance, the important aviation industry. How is it adapting to the continued international economic sluggishness. I suspect exports are down significantly.
I live a state close to Kansas but get little real information.
Thanks again,
Ed
Ed Hanson: As a matter of record, according to the Kansas Department of Commerce, based on BEA data, Kansas 2012 GDP arising from agriculture is … 3.9% of total.
Menzie,
After this I am going to stop picking at nits. Where did I say, “Laffer does not understand Laffer?” Did you mean the Laffer curve as I wrote? As you wrote, “If that is what you meant, you should have written it out. What else is the point of language?”
Thanks for playing though.
Ricardo: I am going to quote you verbatim:
Maybe the Econbrowser readership understands it your way, maybe not. Let’s take a poll…
Well, the broader point Menzie is why waste your time? The graph you posted (and all the other ones) speaks for itself. Brownback and Walker contracted spending in a recession, and its effect on the economy was contractionary compared to past performance. Brown did the opposite in CA, and the effect was the opposite. That should settle it for sane people. Why spend your valuable time arguing with ideologues? They can say spending cuts were not enough, or not correct or anything to continue the argument.
Just keep posting the new data, it is all you have to do to convince the persuadables.
menzie, just a case of ricardo trying to rewrite history. he does it time and again. he is cute when he gets all huffy though 🙂
Menzie:
I followed with great interest your exchange with Steven Kopits.
You say: “To understand what they mean requires context, and context in this case includes what the historical relationship between state specific unemployment rates and national rates is. Otherwise, we would always be running pooled time series cross section regressions instead of (sometimes) running fixed effects regressions.”
You also mention that “From 1976M01 (beginning of monthly state-level data) to 2010M12 (just before Brownback, Walker, Brown), Kansas’s unemployment rate fixed effect was -1.64 ppts, Wisconsin’s -0.86, and California +0.91 (relative to US). So if you are going to compare the efficacy of policies on the unemployment rate (personally I prefer employment levels or economic activity), then at the very minimum you should account for these fixed effects.”
My question is: the number -1.64 for Kansas and -0.86 for Wisconsin, how do you interpret that? What exactly should I do with that number?
Say I would like to calculate the number for Louisiana, the state I work for; what exactly is the regression?
If you have suggestions for further reading, especially in the context of state data, that would be great – thanks.
Have mercy, Menzie, I cannot read every entry in every blog with every comment – I am asking honestly to educate myself.
Manfred
Manfred Just add the fixed effect value to the intercept. So Kansas starts out with an inherently lower unemployment rate relative to the baseline case for reasons that are peculiar to Kansas and unrelated to anything that Gov. Brownback did or did not to. Think of it as a handicap in golf.
Thanks Slugs.
I just want to commend this blog for doing such important work. Remember, the only way the Republicans can even remotely get people to support their anti-worker agenda is if they can convince them it will be worth it by increasing wages and employment. Showing liberal states like California kicking the shit out of conservative states like Wisconsin and Kansas will make this much harder on them. Hence, their hysterical reactions to your posting of FACTS.
“Agriculture accounted for approximately 19 percent of the state’s GDP and directly employs approximately 17 percent of the Kansas labor force -that’s nearly one in five jobs in Kansas.”
Kansas Dept of Agriculture, 2013
https://agriculture.ks.gov/docs/default-source/documents—office-of-the-secretary/kansas-farm-facts-august-2013.pdf?sfvrsn=5
Steve Kopits: Well, let’s see, I understand how BEA calculates the shares. It divides value added by gross state product (which is the sum of value added in all sectors in the state) to obtain the number. I do not know how the Kansas Ag Sec calculated his figure, but I suspect he took total output and divided by state gross state product. Gross farm income was $15 bn in 2011, Kansas GSP in 2012 was about $140 bn, so at least we are in the ballpark of the 19% figure. I know what I learned in graduate school was the right thing to do, and it is not (apparently) what the AgSec did (I think that is why he used the word “accounted”). If you have a new treatise that says it is correct to divide total output by the sum of sector value added in a state, I would welcome learning of it.
So…I’ll stick with 3.9% as reported in the Kansas Department of Commerce website.
Menzie,
In the table “Kansas Employment by Sector”, where is agriculture? Non-durable manufacturing?
Nick G: These data are from the establishment survey, which pertains to nonfarm payroll employment. No agriculture. The AgSec must have obtained the data from another source.
Steve Kopits: I take it by your silence on the matter you agree that dividing total agricultural sector output by GSP is not correct. I further take it that 3.9% is a more accurate depiction of the role of agriculture in the state than 19%. Then I further take it that it does not seem appropriate to blame the “going off the rails” of Kansas employment depicted in Figure 2 on changes in agricultural commodity prices.
Thank you in advance for your time and consideration.
In my experience, Menzie, departments representing various constituencies will tend to color the numbers the way that suits them. I suspect the Ag Dept numbers reflect a broader measurement of agriculture to include dependent activities like processing, transport and related construction, etc. I think the Dept of Commerce has the opposite bias. They want to show Kansas as something more than a cowtown, so they de-emphasize everything ag. Agriculture does not even figure in their list of “Key Industries”. You wouldn’t know, for example, from the Dept of C website that Kansas has the third largest beef herd in the country.
I suspect that agriculture is indeed important in Kansas, and that agriculture and supporting industries do account for 15-20% of output there. And given that agriculture has been a hot sector, I’m not sure how to interpret Barro’s “non-farm employment” graph. In what sense is farm employment not relevant in Kansas?
Take a look at the Kansas Dept of Labor website (below). Note the “Overview” excel spreadsheet on the right. This notes that as of May 2014, Kansas added 23,913 employed individuals (yoy), and of these, 15,700 were “Nonfarm Jobs”. Perhaps I’m reading this wrong, but if I do the math, then 8,213 jobs were by implication “farm jobs”. And this is seasonally adjusted data. So if I added 8,200 farm jobs, that’s more than 0.5% off the unemployment rate right there. If I understand this correctly, then farm jobs are very, very important in Kansas.
https://klic.dol.ks.gov/gsipub/index.asp?docid=472
By the way, not answering doesn’t mean I agree. It means I’m actually doing work I’m supposed to be doing (writing a book on supply-constrained oil markets forecasting) rather than screwing around with Kansas data. Now if you want to debate the outlook for driving trends in the US, well, that’s my hot topic this week. And it’s fascinating.
hmmm. I read your source as saying “”Kansas gained 12,400 private sector and 11,900 nonfarm jobs since May 2013, “. So, 500 jobs out of 12,400 were farm, or about….4%.
That was the change, year over year. Now, the absolute numbers are:
May Employed Individuals 1,427,872
May Nonfarm Jobs 1,383,300
May Private Sector Jobs 1,127,600
So, perhaps we do need to subtract Nonfarm from Employed to get Farm Jobs. That suggests that Farm Jobs equal 44,572, or 3.1% of all employment.
I think there must be something wrong with their “over the Year Change” stats: it’s hard to imagine growth of 8,100 jobs on a base of 45k.
Could this be the Badgers state main problem?
http://consumerist.com/2014/05/30/lets-all-move-to-wisconsin-land-of-plenty/
Menzie, your assertion that the demographic makeup of California is essentially irrelevant with respect to GDP is nonsense. California has every conceivable advantage in terms of climate and natural resources, yet is plagued by policies and demographics that continue to hold it back.
While attracting a significant segment of highly educated people… which should propel California to the top of national economic indicators, the hispanic/illegal population [census includes illegals by race/ethnicity] lags far behind in this category http://www.ppic.org/main/keystat.asp?i=1264#2. This lower educated segment is also more likely to be unemployed and on welfare https://docs.google.com/viewer?url=http%3A%2F%2Fwww.calmis.ca.gov%2Fspecialreports%2FCA_Employment_Summary_Table.pdf. Other sources will show that this segment is also less likely to own a business http://quickfacts.census.gov/qfd/states/06000.html.
Now, I’m not going to go through every state and attempt to delineate all of the possible factors… you can get a grad student to do that for you. But the so-called “bugaboo” you mentioned does appear to have real economic impact. The “bugaboo” would seem to be the prohibition to discuss this without ad hominem retorts. Education levels affect the resilience of a state; Wisconsin is less educated than Minnesota. Ethnic/racial mix on a state and national basis affect educational outcomes.
Menzie In your regression you included a trend variable in order to satisfy Bruce Hall. But the statistics you report do not show that the trend variable is significant. When I run the regressions in the usual braindead OLS fashion I do get a statistically significant trend; however, correcting for HAC robust errors (Newey-West) the trend variable fades into insignificance. So I’m assuming the numbers that you are reporting reflect robust error corrections. The problem is that if I rerun the regression without the insignificant trend, then the Brownback dummy variable is not significant either.
The naïve regressions show a fair amount of positive autocorrelation. Also, the residual for Jan 2009 is an obvious outlier. It’s huge. Ah, the joys of OLS!
Rick Stryker run the regression for Kansas with respect to the US with a dummy set from jan 2011,
I don’t think this is what you really meant to say because the way it’s worded it sounds like you used an impulse dummy for Jan 2011 only. My take is that Menzie was setting a level shift dummy variable. The dependent variable does not show any evidence of a unit root, so you probably don’t want to model Brownback’s regime as an impulse dummy. But like I said, I don’t think that’s what you actually meant to say. I think you meant setting the dummy from Jan 2011 thru May 2014.
Regarding the Kansas vs Iowa regression. When I crunch the numbers without the trend (remember, the trend was supposed to capture California’s mismanagement so it’s not relevant here), I come up with a Brownback dummy of -0.6%. It is just off the edge of significance at the 5% (p-value = 5.46%). Running the numbers for Nebraska I found the dummy as not being significant at all. But then again, Iowa and Nebraska both have idiot Republican governors who are probably just as clueless as Brownback, so there you go.
2slugbaits: Yes these regression results are not robust to changes in specification. I figured better to include the time trend just to guard against omitted variable bias.
2slugbaits,
Yes, I was running the same regression Menzie did, setting the dummy to 1 for Jan 2011 to the present.
I thought there was some justification to include the time trend in both the US and California regressions, since the state coincident index for each state is designed to grow at the same rate as each state’s GDP in the long run. The time trend could capture other variables that might account for differences in growth rates.
Rick Stryker I don’t disagree that there might be very good reasons for including a time trend, although in this case the dependent variable is in first differences and there’s no obvious reason why you would need one. You might, but it’s not immediately obvious. It would take some additional diagnostics. In any event, I was simply pointing out that Menzie’s reason for including it in the KS/CA regression was to account for “the alleged poorly run policies of California” according to Bruce Hall. Of course, the possibility of omitted variable bias is also a good reason. On the other hand, there are lots of other problems as well, including significant autocorrelation in both the residuals and the squared residuals. Not exactly unheard of in time series data.
2slugbaits,
Just to clarify, I kept the time trend for the same reason that Menzie did. Sorry if that wasn’t clear.
There are almost certainly variables that could explain the difference in growth rates and these variables are likely correlated with the dummy variable. If we just omit these variables entirely and just estimate the coefficient on the dummy variable, we can’t trust the dummy variable estimate since we should expect it to be biased and inconsistent. However, in the absence of knowing what additional variables to put into the regression, Menzie’s choice of a time trend is sensible, but obviously not optimal. However, Menzie was just trying to get something quick and dirty going that made some sense.
I don’t think you just want to drop the time trend. The way to improve the regression is to come up with some alternative explanatory variables to replace the time trend.
Krugman, a mouthpiece for the NY Slime and the
advancement of socialism for all; whether you want it or not..
http://news.investors.com/ibd-editorials-perspective/070214-707225-steve-moore-defends-from-paul-krugman-attack.htm
this of the steve moore wsj who has argued for 6 years that we need to raise interest rates immediately to beat back the bond vigilantes who will raid the bond industry!
hans, you may not like krugman. but do you understand how utterly wrong laffer and moore have been during the great recession? there is no beating around the bush, excuses, etc. these guys have been WRONG for years, and anybody who is still listening to them is a fool-and broke!
I’d suggest that you refer to California’s own assessment of its changing population and the impact on its educational attainment … and economy. Refer to pages 15 and 16. http://www.cpec.ca.gov/CompleteReports/ExternalDocuments/Adding_It_Up.pdf
“EDUCATIONAL ATTAINMENT BY RACE AND ETHNICITY
California must address racial and ethnic disparities in the percentage of college-educated
adults, particularly with respect to Hispanics.”
I presume there is adequate correlation for their concern with Hispanics to soon be the plurality in that state.
You can also examine the differences in educational attainment between Wisconsin and Minnesota in this document. You know, of course, that higher educational attainment equates with lower unemployment and more robust economies.