State-level employment figures released this morning by the BLS indicate indicate that as US (and regional peer Minnesota) employment powers along, Wisconsin lags. As does Kansas. Hence, the negative correlation between the ALEC-Laffer economic outlook index and actual economic activity persists [1] [2]
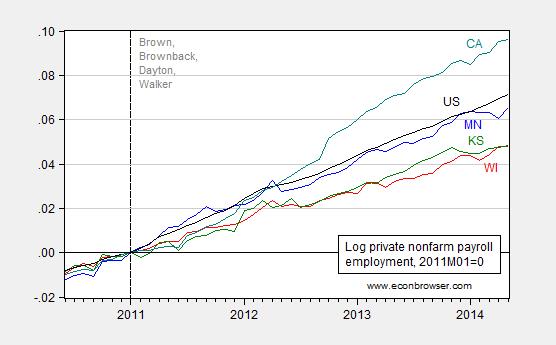
Figure 1: Log private nonfarm payroll employment for Wisconsin (red), Minnesota (blue), California (teal), Kansas (green) and the US (black), all seasonally adjusted, 2011M01=0. Vertical dashed line at beginning of terms for indicated governors. Source: BLS, and author’s calculations.
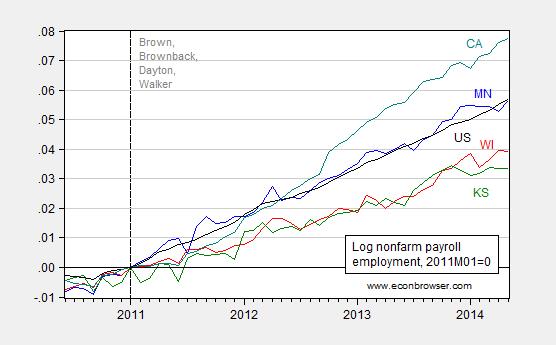
Figure 2: Log nonfarm payroll employment for Wisconsin (red), Minnesota (blue), California (teal), Kansas (green) and the US (black), all seasonally adjusted, 2011M01=0. Vertical dashed line at beginning of terms for indicated governors. Source: BLS, and author’s calculations.
The flat growth for Wisconsin and Kansas are consistent with trends indicated by the Philadelphia Fed’s leading indicators, discussed in this post. Now, this is just one month’s observation, sure to be revised. However, the general pattern of stagnant employment growth remains there. There is little succor to be gained from appealing to alternative labor market measures, such as the Quarterly Census of Employment and Wages. As several reports have noted, Wisconsin came in 37th in 2013 employment growth. [3] Further, as I observed in May, the BLS private employment series will likely be revised downward as a consequence of these QCEW figures.
Note that the gap between the path consistent with Governor Walker’s promise of 250,000 net new jobs and actual employment has increased (to 95,400 from 89,800). This means that 17,100 jobs per month have to be created for each of the next eight months in order to hit Governor Walker’s target, something that is highly unlikely given the mean job creation number (1,700 per month, since 1990M01).
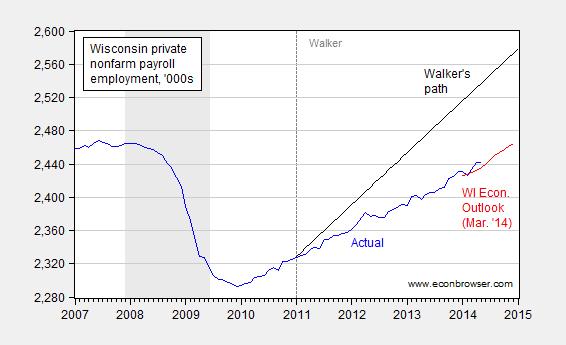
Figure 3: Nonfarm private payroll employment for Wisconsin (blue), quadratic match interpolation of quarterly forecast (red), and linear trend for Walker’s target of 250,000 new jobs (black). Source: BLS and Wisconsin Economic Outlook (March 2014).
On a related note, Ed Hanson stated back in February that he would await the 2013 GSP release before making judgments about the relative performance of Minnesota and Wisconsin. Well, those numbers are in.
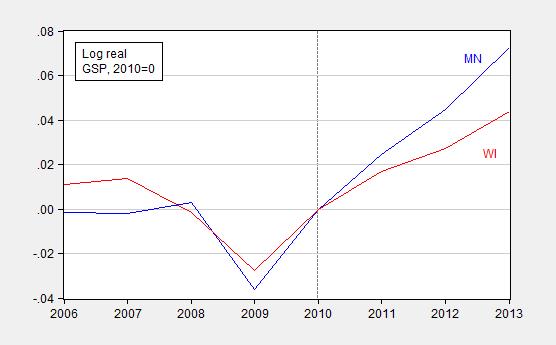
Figure 4: Log real Gross State Product for Minnesota (blue) and Wisconsin (red), 2010=0. Source: BEA, and author’s calculations.
Since 2010, Minnesota has grown a cumulative 2.8% (log terms) more than Wisconsin. Relative to 2011, the cumulative growth is 2.1%.
At that time, Ed Hanson argued that there was an incipient acceleration of Wisconsin per capita growth vis a vis Minnesota. In fact, year-on-year per capita growth for 2013 confirms that Minnesota continues to outpace Wisconsin (2.0% vs 1.4%, in log terms).
Is there a way to get at state level labor participation rates as well? It seems like Wisconsin is following a similar path to North Carolina in that the labor force is shrinking rather than growing and that is causing a drop in the unemployment rate.
By the way, thanks for these posts. It is becoming obvious that the ALEC policies that states like Wisconsin are following lead to sub-standard economic growth.
I think the policies are only designed to put more money in ALEC members pockets. They are probably successful at that.
Here is a powerful quote from an email a friend just sent me.
“If anyone thinks the Fed is trying to do a good job, when its leader admitted she didn’t know what she was doing, he has totally missed the seductiveness of power.”
Minnesota beats all three state using the CES index.
The other three still lag peak employment in either 2007
or 2008.
California still has not recovered from peak employment of
June 2007.
http://www.deptofnumbers.com/employment/california/
Hans,
Regarding California not having recovered employment from the peak in 2007
If I follow the link that you gave, that statement is inaccurate – California just exceeded the peak employment, which BTW was in 2008, not in 2007. (your link, not mine)
Bellanson
Minnesota may have a more cyclical economy.
And, GSP may be a poor measure of living standards. What’s the difference in living standards?
The mix of GSP may vary substantially between states, e.g. some states have more government.
Anyway, I know, from working in California, if I worked this hard in Colorado, I’d be living much better.
Another view of the employment situation in Wisconsin by the Milwaukee Journal http://www.jsonline.com/blogs/news/264113781.html
I blame the thug kindergarten teachers.
For those whom wish to hold Scott “Johnny” Walker accountable for the
lack of Badger employment, you must do the same for Barrock or else
your opinions are mired in mud.
BTW, speaking of BO, remember his promise to double exports in five
years? I was laughing then, I am laughing now.
The Democrat Party has declared war on the state of Wisconsin and is doing all that it can to derail any recovery. Even after the courts ruled that the Democrats were abusing their power, they have still persisted. The Democrats have no interest in the people of Wisconsin other than as a pot of cash for looting. Below is a good summary of what they are doing from Gabriel Malor.
This is a true story: in 2012, Democratic district attorneys in Wisconsin launched a secret probe known as a John Doe investigation with the goal of proving that conservative groups illegally coordinated activities during Gov. Scott Walker’s recall election. They issued more than 100 subpoenas, demanded the private information of conservatives and conservative groups, and actually conducted secret raids. And under state law, individuals who were targeted or witness to the investigation were forbidden from making knowledge of it public.
Fortunately, judges saw right through this partisan abuse of power. Early this year, a state judge, ruling in a secret proceeding, quashed the subpoenas and all but ended the investigation. According to the judge, “the subpoenas do not show probable cause that the moving parties committed any violations of the campaign finance laws.” This started the unraveling of the John Doe investigation that had many conservatives fearing they would be targeted for subpoenas and raids next.
In February, a conservative activist and group filed a federal civil rights lawsuit against the partisan district attorneys who had pursued the John Doe probe. In short order, a federal district court judge held that the plaintiffs “are likely to succeed on their claim that the defendants‘ investigation violates their rights under the First Amendment, such that the investigation was commenced and conducted ―without a reasonable expectation of obtaining a valid conviction.” In other words, at this early stage of the civil rights litigation, it looks to the judge as if the Democratic district attorneys abused their power and chilled conservatives’ free speech rights. Accordingly, the federal judge ordered that the John Doe probe must cease, all the seized property be returned, and all copies of materials be destroyed.
After a short trip to a federal appeals court, the federal judge reissued his order that the John Doe probe cease. Most recently, that appeals court has ordered some of the previously secret probe documents disclosed to the public, including an unsuccessful defense that the John Doe investigators made to one of their secret subpoenas. In their attempt to get a subpoena, which was rejected by a judge for lacking probable cause, the partisan investigators claimed that Walker was involved in the so-called conservative conspiracy.
And that is where the litigation stands as of today. Having launched a secret probe that has now been shut down by both the state and federal courts, the Democratic district attorneys find themselves the subject of an ongoing civil rights lawsuit for infringing the First Amendment rights of conservatives. But that is not how the media have reported the case.
Trade in goods and services, millions
2009 125,920
2010 154,020
2011 192,020
2012 204,490
2013 225,276
With the huge increase in crude exports in 2014 we might just double exports in 5 years. I’m not laughing.
Let us remember that on July 12, 2012, a press release from the office of DWD Secretary Newson stated in BOLD TEXT to offset it from the body of the release:
“The CES (Current Employment Statistics) estimated the state of Wisconsin lost 22,700 private sector jobs from December 2010 to December 2011, when in fact the QCEW – used as the GOLD STANDARD [my emphasis] for jobs data . . .”
This was done during the time that Walker sought refuge for his already failing policies in a campaign to discredit the monthly CES data by claiming that the QCEW data was superior to the CES, as the monthly series was already showing the harsh realities of his counter-productive policies.
How does the petard feel?
Morb
I believe it is you who has brought attention to this July 2012 situation before. Is it possible for you to expand on your reason to bring it up again?
Perhaps you could direct part of the explanation to a couple of things I have researched.
First, for another presentation of the DWD position, if you click the following link and scroll down you will see a color graphic of the extraordinary difference from the CES statistic and the LAU and QCEW statistics as noted in the DWD news release you mention. It seems to me that such a major deviation should be called into question. One or the other should be closer to the actual truth.
BTW for those interested here is the DWD news release, which Morb is referring, with also a copy of its letter to the BLS.
Below is a link to the BLS Wisconsin statewide employment, non-farm, seasonally adjusted. From this chart you will note the gain year-on-year December 2010 to 2011 was a positive 28,000 not the negative 22,700 reported in the BLS news release.
So it seems, the BLS Current Employment Survey was terrible off, as the DWD noted.
Morb; Are you saying it is wrong for the DWD to point out a substantial difference of separate employment surveys? Which survey was more correct? Are you seeing something I don’t? Are you making a different point?
Ed
I see that I messed my HTML above. As best as I can tell by clicking the line beginning with “BTW, for those interested…” you will be directed to the page of the color graphical presentation of the extreme variation between the CES, LAU and QCEW. Or click below if I can get my HTML into shape.
“WISCONSIN EMPLOYMENT & UNEMPLOYMENT ESTIMATES”
Click any of the final lines will direct you the DWD news release with the letter to the BLS. Or below (I hope)
“Secretary Newson Urges Federal Officials to Correct Misleading Data Series “
The BLS Wisconsin statewide employment, non-farm, seasonally adjusted chart (2004 to 2014) can be found at
“Total Nonfarm”
Sorry for the confusion and I hope this correction is correct.
Ed
Perhaps the easiest way to explain it is with a timeline.
January 2011 – The Day of Infamy, Walker regime enthroned.
January 2012 – Wisconsin job growth on the monthly series shows 34,300 jobs, a 1.46% gain. National growth 2.45%; IL – 1.65%; MN – 2.18%; MI – 3.17%. Pressure grows and Walker Administrations begins disinformation campaign about the monthly data series. Additional narrative, charts, graphs and color added to the WI DWD monthly data series release to draw attention supposed “highly volatile numbers” that a subject to “large corrections”.
July 2012 – Wisconsin job growth since 01/11 on the monthly series shows 48,500 jobs, a 2.18% gain. National growth 3.3%, IL – 2.32%; MN – 2.94%; MI – 4.36%. Walker Administration adopts QECW as its “gold standard” per the 07/12/12 press release. This is surprising since in its recall campaign, the Walker Administration will use both the QECW and monthly data series to boast of its job creation record.
Fast forward to Jan. 2014 – Wisconsin job growth since 01/11 on the monthly series shows 103,900 jobs, a 4.37% gain. National growth 6.38%, IL – 3.55%; MN – 6.38%; MI – 6.98%. The Gold Standard (the Walker Administration’s words, not mine) QECW numbers for 2011 – 2013, however, show that Wisconsin is in last place in Midwest job growth with a 4.1% gain with IL getting a penultimate position at 4.3%; MN – 6.1%; MI – 8.1%. I guess pressing a poorly-thought-out disinformation campaign apparently backfired for the Gang-that-couldn’t-shoot-straight.
June 2014 – Wisconsin’s lead over IL grows substantially, and the state’s growth rate finally mirrors the national rate (albeit at a much lower level) but this is only supported by the monthly data series, which as Secretary Newsome has informed us, is very poor data, “error-prone because of its small sample”, “highly volatile” and “subject to large correction”. A pity that; don’t you think?
And hence, how about that petard?
According to the BLS
http://www.bls.gov/news.release/laus.nr0.htm
‘Table B. States with statistically significant unemployment rate changes from May 2013 to May 2014, seasonally adjusted,’ includes Wisconsin at minus 1.1 points. Minnesota doesn’t make that list.
And,
‘Table D. States with statistically significant employment changes from May 2013 to May 2014, seasonally adjusted,’ Minnesota increase jobs by 45,500. Wisconsin beat that at 47,500.
Morb
So you are saying by not saying, that the DWD was correct with there letter to BLS, something was wrong with their statistics back in 2012. Why don’t you just clearly say so.
And BTW, if Menzie truly wished to bring economic news to this blog, his headline would have been, “Illinois and Michigan employment remains flatlines for 1 and 1/2 years.” Perhaps that would keep you from making Illinois your poster child. Just check the BLS, Illinois sucks.
“Illinos non-farm seasonally adjusted”
I can understand that Minnesota has a faster growth rate and lower unemployment than Wisconsin based on the fact that Minnesota has a more homogeneous population that enjoys a 6 percentage point advantage in college educated people. Wisconsin, at 5.7% unemployment is still better that the national average and almost 2 percentage points better than California which is given prominent space at the top of the graphs showing “marvelous” improvement.
So many factors… so easy to cherry pick.
Bruce Hall: That is a truly pathetic defense of the “Wisconsin is just doing fine”. First, the graphs are normalized to 2011M01 for a reason; this is a quasi-natural experiment, in which all 4 states experienced changes in regime. Second, in previous posts (in which you have commented), I have shown other indicators, in levels. If you can provide a graph (which controls for state specific fixed effects — I am hopeful that by now you have checked in Wikipedia what that means) that justifies your exuberance over current administration’s plan for mission accomplished in Wisconsin,I would be please to see it.
Menzie, I see it differently: Wisconsin is a blue-collar state and the non-farm jobs market has been generally more stagnant for the high-school educated and less since 2009. Minnesota has different industries which seem to be weathering the past 5 years better than Wisconsin’s old line companies. Regardless, not having fallen as far since 2007 as California and having a less educated population than Minnesota, it appears reasonable that Wisconsin would not have as steep a job recovery rate as California or Minnesota. Michigan is more like Wisconsin in many respects than Wisconsin is like Minnesota. No great shakes in Michigan despite good profits in the automotive industry.
One might ask: why is California still doing so badly. A two-year change is rather meaningless in the larger systemic problems facing the nation and rust-belt states. And yes, Wisconsin is “doing just fine” (ranked 23rd of 50 in unemployment rates) given the materials with which it has to work. Kansas, with a similar line to Wisconsin on your graphs, has an unemployment rate only 0.2 pp higher than Minnesota. I’d say Kansas is “doing just fine” compared to California.
I’d say you are attempting a “natural experiment” that is not quite natural at all. Two years of politics at the state level has not changed the working environment to the extent that national policies have.
http://money.cnn.com/interactive/economy/state-unemployment-rates/
Bruce Hall: I see. You still don’t understand a fixed effect.