From the The Courier, “Osborne defends austerity measures”:
George Osborne, who has announced plans for a further £3.2 billion squeeze on welfare bill which will hit 10 million of the unemployed and working poor, warned they would be among the ones who would “suffer the most” if there was another crisis.
In Europe, some nations had “backed off” austerity and “here we are in 2014 with a number of those countries facing economic crisis again”.
I won’t recount in detail how misguided this analysis is — Simon Wren Lewis has ably detailed this in detail, most recently here, and earlier here and here. For now, I’ll just show two pictures — per capita income in the US and UK, normalized to the last peak, and last trough.
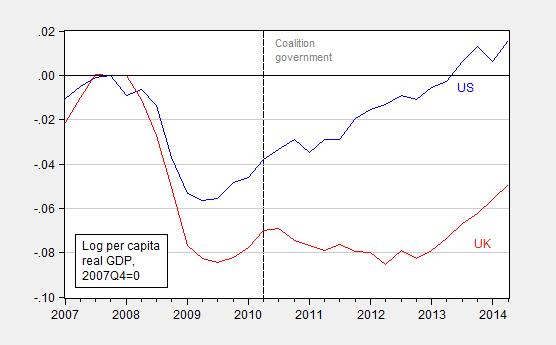
Figure 1: Log per capita US GDP, in Ch.09$ (blue) and per capita UK GDP, in Ch.2000£ (red), all 2007Q4=0. Long dashed line at 2010Q2, coalition government. UK population is annual midyear data from IMF WEO, interpolated using quadratic match. Source: BEA, OECD via FRED, IMF WEO database (April), and author’s calculations.
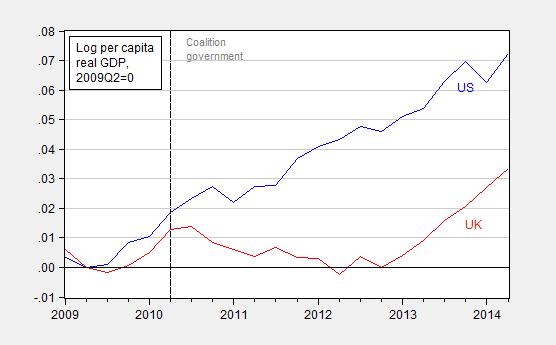
Figure 2: Log per capita US GDP, in Ch.09$ (blue) and per capita UK GDP, in Ch.2000£ (red), all 2009Q2=0. Long dashed line at 2010Q2, coalition government. UK population is annual midyear data from IMF WEO, interpolated using quadratic match. Source: BEA, OECD via FRED, IMF WEO database (April), and author’s calculations.
In other words, while the UK downturn was bigger than the US, in per capita terms, the return of the UK economy to recession follows the implementation of austerity measures. Hence, despite the acceleration in UK GDP, from 2009Q2 to 2014Q2, US per capita income has grown a cumulative 3.5% more in the US than in the UK.
As discussed in this post, divergent fiscal policies account for a large portion of the difference.
Update, 10/8 11:15AM Pacific: Reader Britmous points me out to the latest ONS revision, which includes among other things R&D expenditures and black market activities (the former is in the US series, the latter is not). Here is an updated Figure 2. Note that cumulative growth since the trough in US per capita is still 1.8% higher than UK, even using this more recent ONS measure.
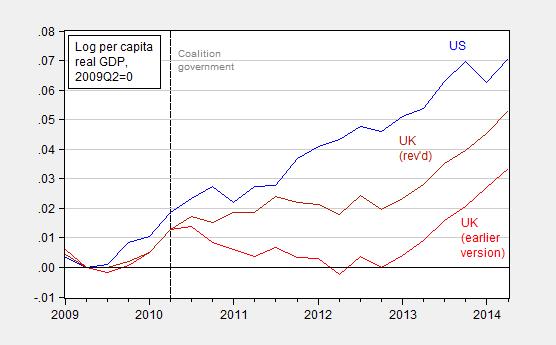
Figure 2A: Log per capita US GDP, in Ch.09$ (blue) and per capita UK GDP, in Ch.2000£ (red), and methodology revised per capita real GDP (dark red), all 2009Q2=0. Long dashed line at 2010Q2, coalition government. UK population used to calculate per capita UK 2000 pound series is annual midyear data from IMF WEO, interpolated using quadratic match. Source: BEA, OECD via FRED, IMF WEO database (April), and author’s calculations.
It’s true – the U.K. adopted a much larger income tax hike than did the U.S., which caused its economy to stall out (the same could have happened in the U.S., but the Fed instituted QE 3.0, which kept the U.S. economy out of recession – although the U.K. had a similar policy, they didn’t do enough to offset the negative impact of their 2010 tax hike.) At least we know that it wasn’t because of government spending cuts:
http://www.tradingeconomics.com/united-kingdom/government-spending
For fun, set the start year to 2004 or 2005 (to see about 10 years worth of data) and compare the results with the United States for its government spending indicator.
US shale oil production began to surge in Q3 2011. See graph 1 in my presentation: http://www.prienga.com/blog/2014/10/1/a-supply-constrained-view-of-the-production-surge
Interestingly, if you look at the industrial production data it shows that US energy production has outpaced non-energy production.
That was largely because energy production barely fell during the recession.
If you compare industrial production of energy — that includes oil — since the 2009 recession bottom however, energy production has grown less than non-energy production. This suggest that the shale oil boom has made a much smaller contribution to growth in this recovery than is generally believed.
Spencer, “Peak Oil,” facilitated adjustments, e.g. energy efficiency.
Energy is still needed to produce output and maintain living standards.
The U.S. imported less oil, which narrowed trade deficits, raising GDP.
The production of shale oil, with multiplier effects, also raised GDP.
Moreover, consumers spent less on gasoline (than otherwise) and more on other products.
Oil prices rose, from $10 a barrel in the late ’90s to $150 a barrel in the mid ’00s, fell in the recession, rose in the initial stages of the recovery, and then basically stabilized.
These graphs do not show a relationship between austerity policy (which both the US and UK have implemented since 2010) and GDP growth, so they are essentially meaningless for this argument. If the scatter plot in the link at the bottom of the post was updated through the same time period as the above graphs, and included in this blog post, this analysis would be more robust.
Could you add the updated scatter plot through 2014?
Anonymous: You can do it yourself, since all the data sources are available from the IMF WEO. Here are scatter plots including for the 2010-12 period, for which you say the austerity measures really bit.
But truly, you are fighting a losing battle — for countries at the ZLB, austerity has been demonstrated to be a sure-fire way to cut growth.
I don’t doubt that austerity cuts GDP growth, and did not say otherwise. I am questioning the robustness of your analysis, not your conclusion, because the charts in this post are normalized to 2008 and go through 2014; however, your supporting data (the scatter plots) chooses a seemingly random time period to support your point.
If I have time I will plot all of the time periods between 08 and 14 (that is, what, about 20 graphs).
It seems, U.K. trade deficits increased.
While, U.S. trade deficits shrunk around $300 billion a year, or about 2% of GDP (which raises U.S. GDP).
Views of Job Market Tick Up, No Rise in Economic Optimism
PEW Research
SEPTEMBER 4, 2014
“Current ratings of the national economy are dim: 48% say the economy is in only fair shape, while 31% say it is in poor shape; just 21% say the economy is in excellent or good shape.”
Thanks PEW…….. The economy is good or excellent for 2 out of ten citizens. Those of us not employed by PEW kinda had that figgered. Bet you got paid anyway. At a make-work rate I presume.
Menzie wrote:
“…austerity has been demonstrated to be a sure-fire way to cut growth.”
This is only true if you believe that austerity is a drag on an economy rather than the consequences of failed pump priming. Austerity is not a recovery policy but a survival policy, the consequence of overindulgent excess.
Austerity is an attempt to correct budget imbalances. This can be done by reducing public sector spending, or by increasing public sector income. Cuts in public spending constitute an immediate cut in final aggregate expenditure (real GDP); higher public income can come from either higher tax rates, or a higher tax base. Higher tax rates transfer spending power from the private sector to the public sector, and constitute a cut in aggregate expenditure (real GDP) if not spent. A higher tax base can only be obtained through GDP (and income) growth, which is curtailed by public spending cuts. Austerity is not the natural “consequence” of anything nor a “survival policy”, but a government’s choice of action, sometimes misguided, sometimes not.
“George Osborne, who has announced plans for a further £3.2 billion squeeze on welfare bill which will hit 10 million of the unemployed and working poor, warned they would be among the ones who would “suffer the most” if there was another crisis.”
let’s make sure they hurt now, so if something bad happens in the future they are better prepared to handle the pain! geesh. let’s not wait to kick a man while he’s down, lets trip him first and get right to the fun stuff!
Comment from a friend whom I sent this:
Looks like it uses the old, now wrong UKGDP figs. Also would be interesting to see comparison with other countries, EZ etc
John Butters: Please convey to your friend the following information regarding the UK series. It is: “Gross Domestic Product by Expenditure in Constant Prices: Total Gross Domestic Product for the United Kingdom, NAEXKP01GBQ652S, Organisation for Economic Co-operation and Development, Main Economic Indicators (Not a Press Release), Seasonally Adjusted, Quarterly, Chained 2000 National Currency Units”, released October 2, 2014.
I know that there is some dispute regarding the calculation of real GDP (see this post), but this is the most recent series available.
Menzie, the OECD series you are using is not “the latest data” for the UK, though it might be the latest data which the OECD publish. The ONS published a major revision of UK GDP last month. The official time series for per capita RGDP using revised data is here:
http://www.ons.gov.uk/ons/datasets-and-tables/data-selector.html?cdid=IHXW&dataset=ukea&table-id=X11
I am not sure what these posts are supposed to “prove”. The October IMF update I just downloaded says the US has reduced the structural balance by 4.4% over 2010-2013 (estimated for 2013), and the UK has reduced by 4.6% over the same period, i.e. the different in the amount of “austerity” is a rounding error. If you want to show the effects of “austerity” on RGDP, surely this is not the comparison to make.
(US productivity is up 10% 2008-2013. UK productivity is flat. It’s possible to believe the supply-side matters as well as the demand-side.)
Britmous: I stand corrected regarding the new ONS series. I have added the series in Figure 2a in the post. Notice the US still grows faster, cumulative 1.8% (log terms).
If you include 2013, I agree that the difference is not so great — that is partly because of the sequester in the US (starting in 2013). I think it undeniable that during the period 2011-12, a gap widens between the US and UK. That is the relevant point, and that point remains.
I do wonder what the gap would look like if the US included black market activities in a fashion similar to what the UK ONS series does. If you have any information in that regard, I would welcome hearing it.
I am unsure what your point about the sequester is. The relative strength in the level of US per capita RGDP vs the UK does not shrink significantly in 2013 even in log terms, though that does happen in 2014 Q1. But the sequester was in 2013, correct?
Indeed, the US grew at 2.4% over the four quarters to 2013 Q4, whereas the UK grew 2.0%. So the UK stopped falling behind in 2013 – that is true, but it is because the UK grew faster, not because the US grew slower. Is your argument that the US sequester raised UK real GDP?
Looking at growth since the beginning of 2010, the relative strength of US per capita real GDP begins in 2011 Q4 and continues through 2012. But British Keynesians now argue that the UK did not have contractionary fiscal policy in 2012 (as Wren-Lewis et al have made clear in the “Plan B” post). The IMF figures on the structural balance agree.
But the IMF structural balance figures also say that US fiscal contraction continued apace in 2012. So if you want to make the case that the relative strength of fiscal contraction has made a significant difference to the relative performance of UK and US real GDP, I don’t know why you want to rely on 2012.
Again, I will say this: the relative outperformance of US productivity (output/hour) begins in 2012, and roughly (though not perfectly) matches the relative outperformance of US real GDP. It is possible to believe the supply-side matters as well as the demand-side.
Peak Trader,
You say “trade deficits decreased,” what has happened to total UK trade? Mises makes the point that efforts to reduce trade deficits may do just that but they actually reduce total trade, both exports and imports. The focus on trade deficits misses the fact that total trade is reduced and that means total production and prosperity in the attempt to change one statistic.
I didn’t say “decreased.”
It looks like U.K. trade deficits increased.
It seems, the U.K. economy was stronger than the E.U. economy.
Reducing transfer payments isn’t the same as government spending on goods and services (i.e. traditional Keyensian G). Other commentary on why your linkback article is misleading as well as definitions of UK and US “austerity”.
http://www.economonitor.com/dolanecon/2014/01/02/austerity-and-the-euro-in-two-graphs-a-reply-to-paul-krugman
http://andolfatto.blogspot.com/2013/11/flatlining-in-uk.html
http://www.themoneyillusion.com/?p=24017
http://www.themoneyillusion.com/?p=22306