Monthly Archives: May 2018

Guest Contribution: “Exchange rate forecasting on a napkin”

Today we are fortunate to present a guest post written by Michele Ca’ Zorzi (ECB) and Michal Rubaszek (SGH Warsaw School of Economics). The views expressed are those of the authors and do not necessarily reflect those of the ECB.


We have just released a new ECB Working Paper entitled “Exchange rate forecasting on a napkin”. The title highlights our desire to go back to basics on the topic of exchange rate forecasting, after a work-intensive attempt to beat the random walk (RW) with sophisticated structural models (“Exchange rate forecasting with DSGE models,”).

Continue reading

Guest Contribution: “The Exposure of U.S. Manufacturing Industries to Exchange Rates”

Today, we’re fortunate to have Willem Thorbecke, Senior Fellow at Japan’s Research Institute of Economy, Trade and Industry (RIETI) as a guest contributor. The views expressed represent those of the author himself, and do not necessarily represent those of RIETI, or any other institutions the author is affiliated with.


On March 8th President Trump announced 10 percent tariffs on aluminum imports and 25 percent tariffs on steel imports. On April 2nd China retaliated by announcing tariffs of up to 25 percent on imports of pork, soybeans, and other products. The European Union is also considering retaliatory tariffs. This tit-for-tat conflict spawns uncertainty, raises prices of key inputs for downstream industries, forces companies to engage in time-consuming appeals to the government, and risks making American products toxic to hundreds of millions of nationalistic Chinese consumers. It is no wonder that Deardorff and Stern (1997) said that using tariffs to correct distortions is like performing acupuncture with a fork.

Continue reading

Things I Never Thought I’d Have to Explain on Econbrowser: Trade Creation/Trade Diversion

Suppose you (the UK) are in a tariff-ridden world, getting butter from your former colony and current Commonwealth partner New Zealand, the global low cost producer. Then you (the UK) decide to join a customs union that encompasses Denmark, which produces butter at a lower cost than the UK, but higher than New Zealand. In plain words, the tariffs between UK and Denmark on butter go to zero, while those between UK and NZ remain.

Is the UK better or worse off?

Continue reading

How to Reduce the US-China Trade Deficit by $200 Billion: A Modest Proposal

Jim Tankersley/NYT discusses how hard it will be to reduce the $337 billion US-China gross trade deficit by $200 billion by increasing exports (as I point out in this post, our trade deficit in value added is probably about half the $337 billion).

The enormity of the task of cajoling the Chinese into buying $200 billion more is shown in Figure 1 (see the light blue arrow).


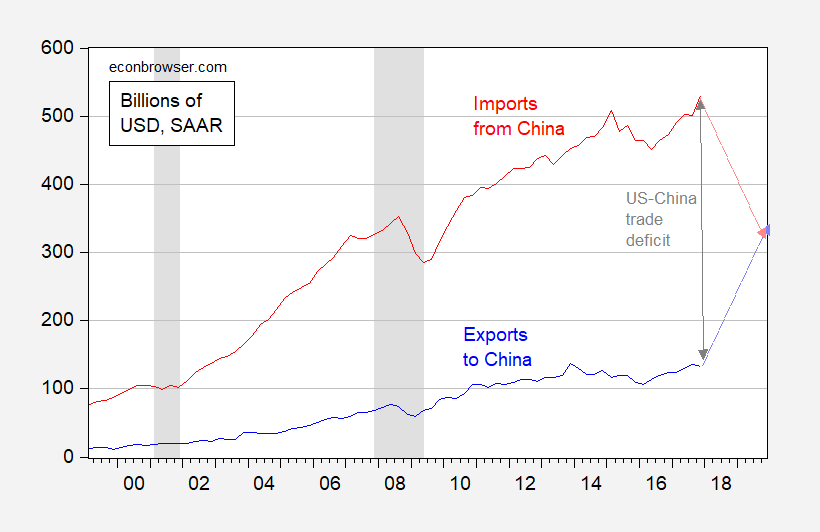
Figure 1: US exports to China (blue) and US imports from China (red), in billions of USD, SAAR. NBER defined recession dates shaded gray. Increasing exports to China by $200 billion over two years (light blue arrow); decrease imports from China by $200 billion over two years (pink arrow). Source: BEA/Census, NBER, author’s calculations.

A much simpler way to reduce the deficit; instead of browbeating the Chinese into buying $200 billion dollars more, just throw the US economy into a deep, deep recession, and reduce US imports from China (the pink arrow).

In Cheung, Chinn and Qian (Review of World Economics, 2015), we estimate the income elasticity of US imports from China is in the range of 2.6 to 3.4 (Table 3). $200 billion is about 0.40 of $506 billion (US imports from China). Assuming a high income elasticity of 3.4, all we need to do is reduce US GDP by 11.6% (about $2.32 trillion in for US nominal GDP of nearly $20 trillion in 2018Q1). Of course, this is ballpark, particularly because many things would not stay constant — the USD/CNY exchange rate would doubtless change, as would US exports to China. But you get the idea.

Now one could say this is a crazy idea; I say it’s no more crazy than building a wall with Mexico and forcing them to pay, banning all immigrants from s***hole countries, doubling Amazon’s shipping costs with the US postal service, collaborating with the Russians on cybersecurity, implementing a border adjustment tax, arming teachers to protect students, and a myriad of other Trump musings.

Tales from the Midwest (Macro Spring Meetings, That Is)

Program here. Here are a couple of papers I found of interest.

From the Empirical Macro session:


  • Output response to government spending: Evidence from new international military spending data,” By Viacheslav Sheremirov; Federal Reserve Bank of Boston, Sandra Spirovska; University of Wisconsin, Madison

    Using 25 years of military spending data from more than a hundred countries, this paper provides new evidence on the effect of government spending on output. Following a popular assumption that military spending is unlikely to respond to output at business-cycle frequencies—and exploiting variation in military spending of a significantly larger magnitude than in the previous literature based on U.S. data—we find that the pooled government spending multiplier is small: below 0.2. This estimate, however, masks substantial heterogeneity: the debt financed
    spending multiplier is larger and can be well above 1 if monetary policy is accommodative. The multiplier is especially large in recessions and when the government purchases durables. e also document substantial heterogeneity across countries with the spending multiplier larger in advanced economies and in countries with a fixed exchange rate. The output response to government spending persists for about two to three years. These findings suggest that the effectiveness of fiscal policy depends largely on the economic environment, policy implementation, and the central bank’s response, and that the small multipliers found in historical or pooled data are a poor guide to evaluating the effectiveness of a specific stimulus program.

From the Monetary Policy session:


  • “Has Globalization Changed the Business Cycle and the Monetary Policy Trade-offs?” by Enrique Martinez-Garcia; Federal Reserve Bank of Dallas

    No presentation/paper online, but the answer is “yes”.

Tomorrow, there’s the Sovereign Debt session:


  • Optimal Redistributive Policy in Debt Constrained Economies,” by Monica Tran Xuan; University of Minnesota

    This paper studies optimal taxation in an open economy subject to redistribution motive and long-run binding debt constraints. The debt constraints arise endogenously from the government’s limited commitment, and become relevant in the long run due to the impatience of the domestic agents. Marginal and lump-sum taxes are allowed to distribute resources across heterogeneous agents. The standard Ramsey results of labor tax smoothing and zero capital tax limit no long hold. The optimal labor tax decreases as the debt constraints bind, and eventually converges to a real limit. The optimal capital tax is positive in the long run. The effcient contract features front-loading redistribution and back-loading efficiency, allowing the economy to accumulate a large external debt position, and increase its borrowing capacity when the debt constraints bind. A numerical exercise of the model demonstrates that a higher redistribution motive leads to a higher labor tax rate during the unconstrained-debt periods, a lower labor tax limit, and a higher external debt accumulation over time.

  • “Sovereign Risk Premia and Corporate Balance Sheets,” by Steve Pak Yeung Wu; UW-Madison

  • Real Interest Rates and Productivity in Small Open Economies,” by Tommaso Monacelli; Università Bocconi and IGIER; Luca Sala; Universita’ Bocconi; Daniele Siena; Banque de France

    In emerging market economies (EMEs), capital inflows are associated to productivity booms. However, the experience of advanced small open economies (AEs), like the ones of the Euro Area periphery, points to the opposite, i.e., capital inflows lead to lower productivity, possibly due to capital misallocation. We measure capital flow shocks as (exogenous) variations in (world) real interest rates. We show that, in the data, the misallocation narrative fits the evidence only for AEs: lower real interest rates lead to lower productivity in AEs, whereas the opposite holds for EMEs. We build a business cycle model with firms’ heterogeneity, financial imperfections and endogenous productivity. The model combines a misallocation effect, stemming from capital inflows, with an original sin effect, whereby capital inflows, via a real exchange rate appreciation, affect the borrowing ability of the incumbent, marginally more productive firms. The estimation of the model reveals that a low trade elasticity combined with high (low) firms’ productivity disperions in EMEs (AEs) are crucial ingredients to account for the different effects of capital inflows across groups of countries. The relative balance of the misallocation and the original sin effect is able to simultaneously rationalize the evidence in both EMEs and AEs.

Semi-automatic Rifle Use and Mass Shooting Casualties, 1982M08-2018M04


Figure 1: Cumulative mass shooting fatalities from incidents where semi-automatic rifles used (blue), non-fatal injured (light blue), fatalities where other weapons (handguns, semi-automatic handguns, rifles, shotguns) used (red), non-fatal injured (pink), through April 2018. Light green denotes assault weapons ban. Orange denotes 2017M01-2018M04. Source: Mother Jones, accessed 5/18/2018, and author’s calculations.

The above graph does not incorporate the estimated 10 deaths and additional injuries incurred today in Santa Fe, TX.

Cumulative Mass Shooting Casualties since 2009M01, 2017M01

Thankfully, Mr. Trump in conjunction with the Republican controlled Congress have implemented policies to address this issue in manner supported by evidence-based research.


Figure 1: Cumulative fatalities from mass shootings since 2009M01 (blue), since 2017M01 (red), on a log scale. May observation assumes lower bound of 8 fatalities. Source: Mother Jones accessed 5/18, news accounts, author’s calculations.

It took 4-1/2 years from 2009M01 to match the number of fatalities that have been recorded in the 16 months since 2017M01.

Continue reading