Word is that Stephen Moore is in the mix for NEC staff. I think he would fit in perfectly in the Trump White House (hence the reference to Rosabeth Moss Kantor’s concept of “homosocial reproduction”). After all, NEC Chair Kudlow just said the budget deficit is shrinking. Now, consider these instances of Mr. Moore’s sheer mendacity (or, I admit, it could be statistical incompetence):
May 31, 2017:
I just heard Stephen Moore of Heritage Foundation saying we had a trillion dollar budget deficit, in a debate on CNN about the Paris Accord (1:42PM CST).
The FY 2017 budget deficit is $603 billion, according to the just released budget (see Table S-1). Add his serial lying to the statistical atrocity that is the ALEC-Laffer-Moore-Williams index, and all I can say is Mr. Moore should not be paid as a “CNN economic analyst”.
Update, 7:14 PM Pacific: I’d forgotten this tabulation of errors by Mr. Moore. The man has no shame.
July 21, 2017:
“For now, there is nothing the matter with Kansas.” – Stephen Moore, June 17, 2014
Readers will recall that, in response to CNN bringing Stephen Moore on board as an “economics analyst”, I noted that Stephen Moore is a liar. Now I continue with the Kansas edition.
For those who forgot, in the original Wichita Eagle piece, Moore wrote:
No-income-tax Texas gained 1 million jobs over the past five years; California, with its 13 percent tax rate, managed to lose jobs. Oops. Florida gained hundreds of thousands of jobs while New York lost jobs. Oops. Illinois raised taxes more than any other state over the past five years, and its credit rating is the second lowest of all the states, below that of Kansas.
For those who don’t believe all of this, here are the numbers for job creation of the four largest states over the past 20 years: Texas, up 49 percent; Florida, up 35 percent; California, up 19 percent; New York, up 4 percent.
As the Wichita Eagle itself recounted (as it decided to no longer publish pieces by Moore):
Correction: The 5-year time period mentioned in this piece was December 2007 to December 2012. Over that time, Texas gained 497,400 jobs, California lost 491,200, Florida lost 461,500 and New York gained 75,900. The totals in this piece are incorrect.
This is old news (by the way, the version posted on the Heritage Foundation makes no mention of this egregious error). But it behooves us to remember this episode because it highlights the extent of the man’s mendacity. Now as the Brownback experiment has ended, it’s useful to see exactly how disastrous the Moore prescription has been for the Kansas economy.
From June 7th post:
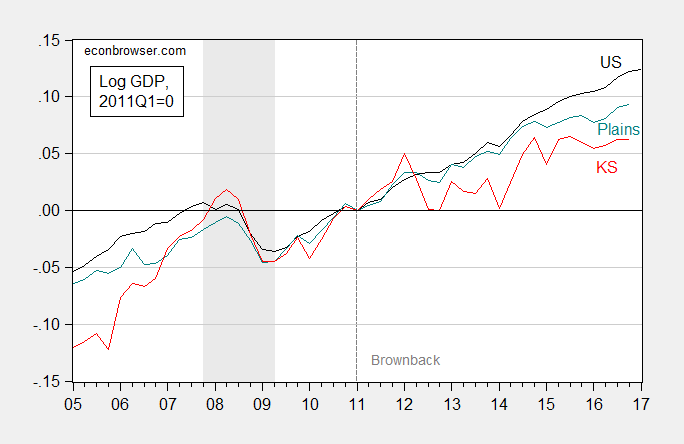
Figure 1: Log GDP relative to 2011Q1 for US (black), Plains (teal), and Kansas (red). NBER defined recession dates shaded gray. Source: BEA, and author’s calculations.
From May 27th post:
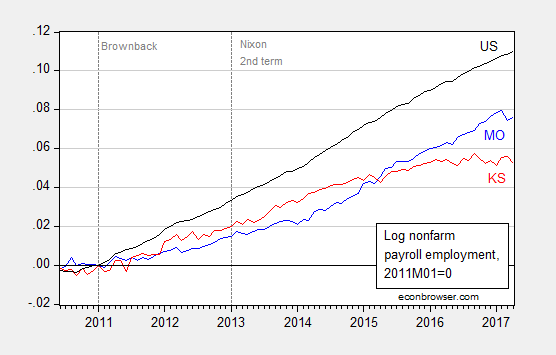
Figure 2: Log nonfarm payroll employment for Missouri (blue), Kansas (red), and US (black), seasonally adjusted, 2011M01=0. Source: BLS, and author’s calculations.
And from September 2016, an assessment of what a counterfactual with no government spending reductions cum tax cuts would have implied for Kansas (it would’ve done better than under the Brownback program):
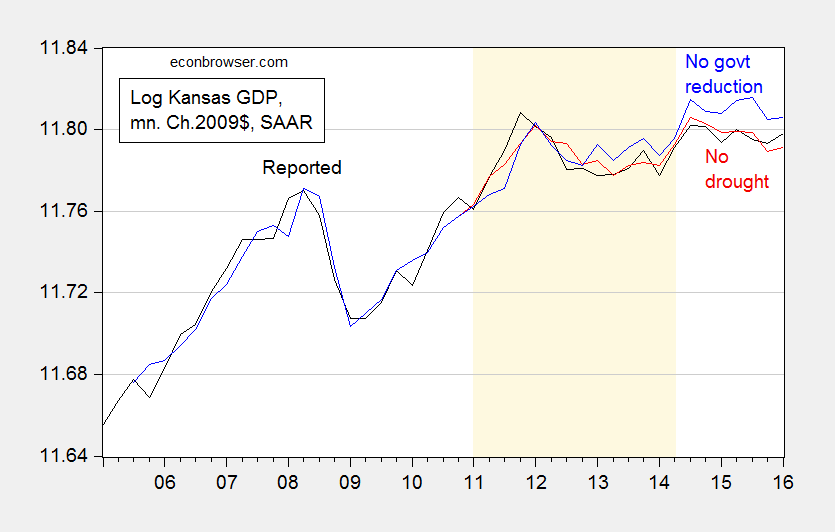
Figure 3: Log Kansas GDP (black), fitted values without drought (red), and without government output reductions (blue). Drought dates as suggested by Political Calculations (light brown). Source: BEA, and author’s calculations.
Watch for more chapters of “Stephen Moore Is a Liar” as long as CNN continues to employ him as an “economics analyst”
January 1, 2018:
Since reader Rick Stryker is still busily trying to defend lying in the cause of a deeper truth, let me document fully the mendacity of Stephen Moore. On May 31st on CNN, he states the budget deficit is $1 trillion.
Here are actual data on actual budget deficit as reported by the Office of Management and Budget (bold blue).
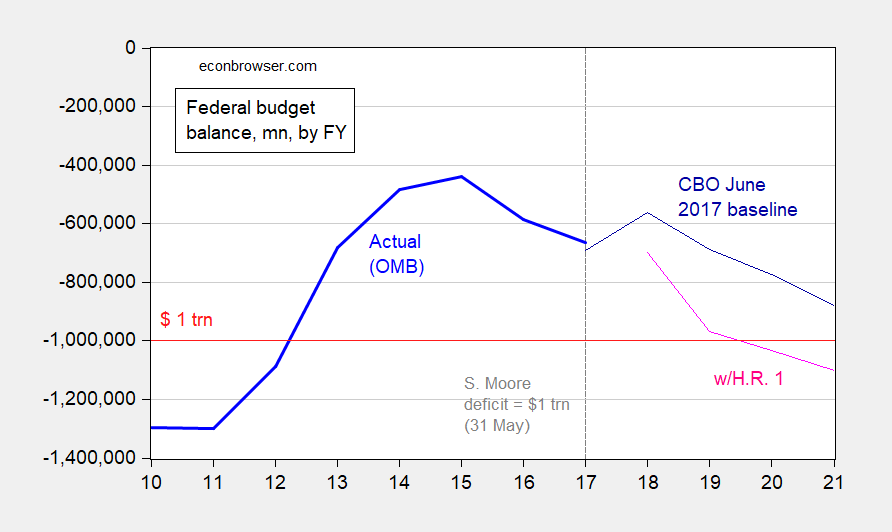
Figure 1: Federal budget balance as reported by OMB (bold blue), and CBO projection (dark blue), and implied budget balance under HR 1 Tax Cuts and Jobs Act (pink), in millions of dollars by fiscal year. Source: OMB via FRED, CBO.
Rick Stryker today leaps to Mr. Moore’s defense to write:
Menzie accused Steven Moore of being a liar or statistically incompetent (or both) since Moore said that the last time he checked the deficit was $1 trillion but in fact the budget deficit is on the order of $600 billion. Here, Menzie was making the incorrect assumption that the budget deficit is always an accurate estimate of the change in borrowing actually performed by the Treasury and that therefore the budget deficit is the only legitimate way to measure that change.
Since I was listening to CNN, I think I know what I heard (as opposed to mind reading Mr. Moore, and asserting he meant Federal borrowing) — he said budget deficit. For this, there is an official definition, one that OMB reports, CBO uses, etc. But if you doubt me, here is the exact quote from a transcript:
MOORE: Because, the reason is that the rest of the world wants our money. And that is all about financing a climate change industrial complex around the world, and we’re the ones who are going the fund it. And last time I checked, we have a trillion-dollar budget deficit and we don’t have the money to send to all of the countries.
Apparently Mr. Moore had not checked for some four years, if we are to take this statement at face value. (Of course, Rick Stryker will assert this transcript is “fake news” since it came from CNN). Do note, he says “budget deficit”, not Federal borrowing…if we are to believe CNN (and my recollection).
But let’s say borrowing is what he meant. Well, as of 2017Q3, the one year change in Federal debt held by the public (so matching FY2017) was $504 billion — still short of a trillion dollars. Let’s give Mr. Moore a break, and remember he made the comment on May 31st. As of the end of 1st quarter, the one year change was $445 billion. For me (I don’t know what kind of math other people use), that’s a lot less than $1 trillion.
So, prepare for more alternative facts, alternative definitions, mind-reading, general dissemblement and other mental gyrations in defense of lying in the new year. It’s already started.
Addendum: Rick Stryker writes I should apologize to Stephen Moore for misrepresenting his comments. He writes:
…I feel compelled to point out that on this New Year’s Day that a good New Year’s resolution for you would be to put up a (very long) special post apologizing to everyone you attacked with mistaken analysis over the previous year. You could start the post by apologizing to Stephen Moore. …
Let’s take a poll — how many agree with Rick Stryker?
January 2, 2018:
On July 9th, 2014, the Wichita Eagle published an op-ed by Mr. Stephen Moore:
No-income-tax Texas gained 1 million jobs over the past five years; California, with its 13 percent tax rate, managed to lose jobs. Oops. Florida gained hundreds of thousands of jobs while New York lost jobs. Oops. Illinois raised taxes more than any other state over the past five years, and its credit rating is the second lowest of all the states, below that of Kansas. [emphasis added MDC]
Now, as of July 9th, one would know employment figures for May 2014. Let’s plot the data that he should have been looking at.
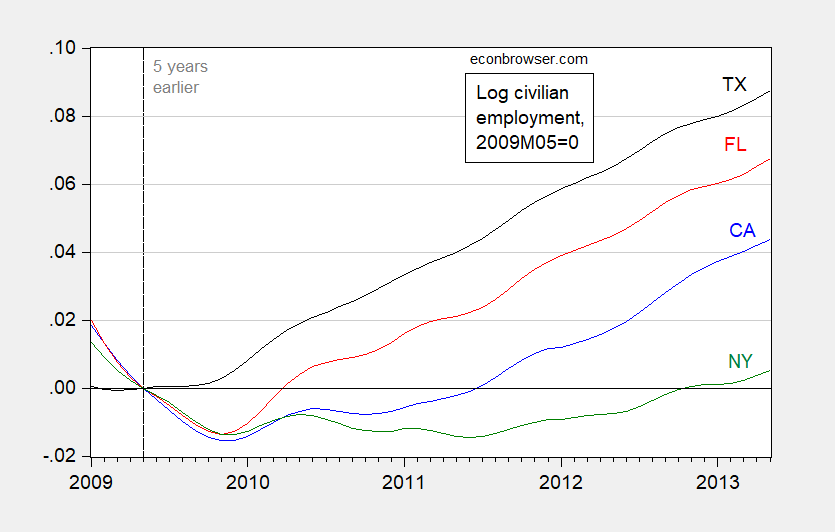
Figure 1: Log civilian employment for California (blue), Florida (red), New York (green), and Texas (black), all normalized to 2009M05. Source: BLS and author’s calculations.
The astute observer will note that this graph does not match with Stephen Moore’s characterization. Yael Abouhalkah determines that one reason for the disjuncture is that Moore actually used calculations for December 2007 to December 2012. Why would Mr. Moore use a sample ending in 2012 for an article in mid-2014? Maybe because the picture is much more amenable to his thesis.
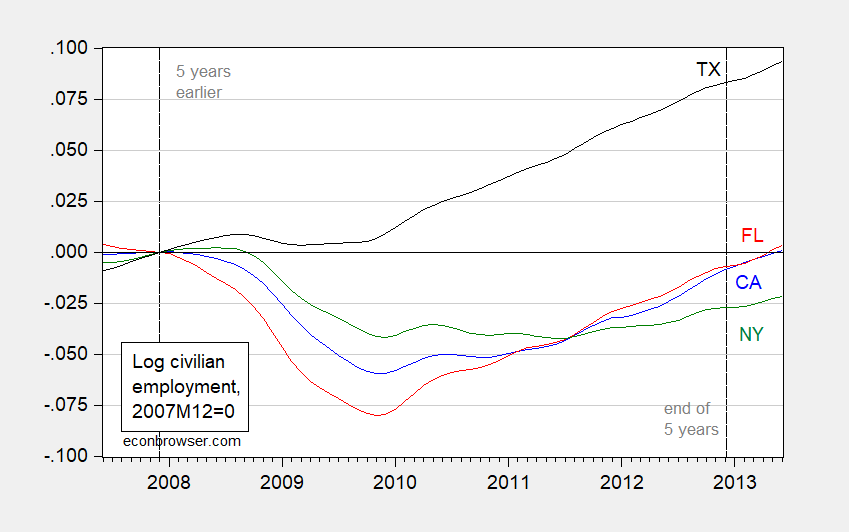
Figure 2: Log civilian employment for California (blue), Florida (red), New York (green), and Texas (black), all normalized to 2007M12. Source: BLS and author’s calculations.
Notice, even then, the pattern of changes does not match up with what Mr. Moore described. That’s because he added up the numbers incorrectly. Moreover, the household survey, upon which the civilian employment series is based upon, imprecisely measures employment at the state level, given the relatively small samples used (see this graphical depiction). The latest vintage of these series differs from those Mr. Moore knew of in July 2014.
Why did he use this imprecisely measured series? This question takes on a heightened importance given Mr. Moore’s emphasis on “jobs” in the op-ed, since the establishment series tabulates jobs, while the household series tabulates employed individuals. What does Figure 1 look like using nonfarm payroll numbers?
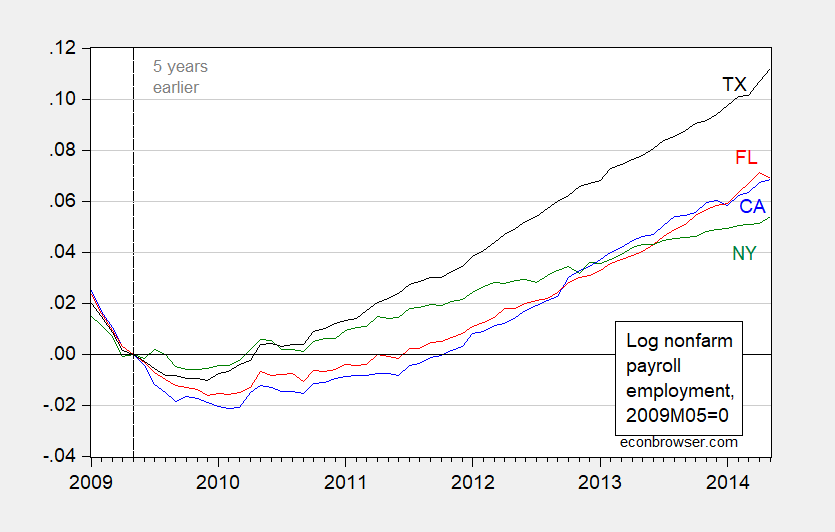
Figure 3: Log nonfarm payroll employment for California (blue), Florida (red), New York (green), and Texas (black), all normalized to 2009M05. Source: BLS May 2014 release via ALFRED and author’s calculations.
Note that, while Texas still leads, Florida and California tie, hence casting doubt on the thesis that low income taxes necessarily lead to faster employment growth. Of course, anybody with a rudimentary knowledge of the (absence of) correlation between the Moore-Laffer-ALEC economic outlook ranking and economic growth would know any relationship found by Mr. Moore would be fragile.
This episode prompted the Kansas City Star to ban Mr. Moore from their publication.
Mr. Moore has never provided an explanation for the selection of time sample used in his original op-ed. Something to remember when he asserts tax cuts result in higher tax revenues (also in 2005).
July 11, 2015:
In addition, Stephen Moore is collaborator with Arthur Laffer and John Williams on the ALEC-sponsored Rich States, Poor States economic outlook index, which apparently has pretty much zero correlation with subsequent economic performance.
From an Econometric Assessment of the World according to the American Legislative Exchange Council (ALEC)
For eight years, the American Legislative Exchange Council has been producing a ranking that purports to measure the competitiveness of individual states. From ALEC, Rich States, Poor States, 2015:
The Economic Outlook Ranking is a forecast based on a state’s current standing in 15 state policy variables. Each of these factors is influenced directly by state lawmakers through the legislative process. Generally speaking, states that spend less—especially on income transfer programs, and states that tax less—particularly on productive activities such as working or investing—experience higher growth rates than states that tax and spend more.
Hence I think it is reasonable to ask whether the ALEC-Laffer-Moore-Williams “economic outlook” ranking (hereafter “ALEC ranking”) actually has any predictive power, above and beyond other demographic and geographic indicators. This analysis follows up on a more ad hoc analysis in this post, and confirms conclusions arrived at in Fisher w/LeRoy and Mattera (2012). In addition, this analysis serves as a rejoinder to ALEC’s rebuttal asserting that critiques did not incorporate sufficient controls and allow for differing time horizons, to wit:
Moreover, rigorous statistical methods show that a higher economic outlook ranking in Rich States, Poor States does indeed correlate with a stronger state economy.
H/t Michael Hiltzik, who has done a tremendous job tracking the ALEC ranking. Let’s examine the available data.
Figure 1 depicts the one year growth in real Gross State Product and the ALEC ranking, lagged one year, for growth over the 2008-2014 period. Should the ALEC thesis be correct, one should see a negative sloped relationship.
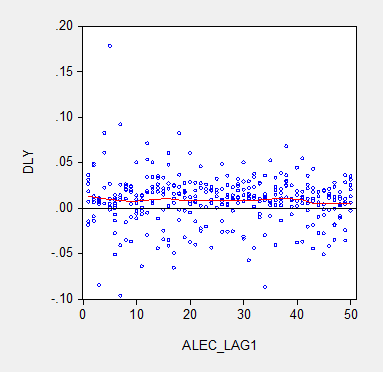
Figure 1: Real Gross State Product growth (log first difference) and lagged ALEC ranking for Economic Outlook. Nearest neighbor fit line (red), window = 0.3. Source: BEA and ALEC, Rich States, Poor States, 2015, and author’s calculations.
There is no obvious correlation between annual growth rates and the ALEC rankings. Note that lagging the ranking so that, for instance, the growth rate between 2013 and 2014 is related to the ALEC ranking in 2012 (instead of 2013) does not change the results much. (The ALEC 2013 ranking pertains to data reported in 2012, as far as I can tell). This outcome is unsurprising because the ALEC rankings are highly persistent. If one estimates a panel autoregressive model for the ALEC rankings, the AR coefficient is 0.95, and the adjusted R2 is 0.90.
Defenders of the ALEC rankings have argued that the rankings are aimed at predicting growth at a longer time horizon than annual. Given that the perspective of the RSPS methodology is supply-side, this argument is prima facie sensible. In order to accommodate that argument, I display in Figure 2 the data for three year (nonoverlapping) horizons (for 2014, and 2011).
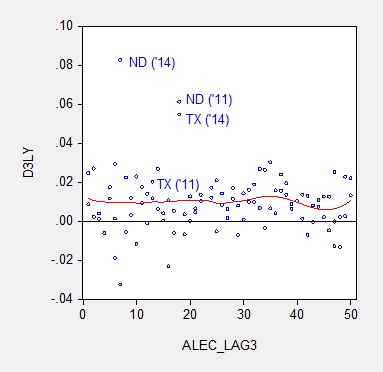
Figure 2: Nonoverlapping average three year real Gross State Product growth (log difference) and three year lagged ALEC ranking for Economic Outlook. Nearest neighbor fit line (red), window = 0.3. Source: BEA and ALEC, Rich States, Poor States, 2015, and author’s calculations.
Figure 3 provides analogous information, at the six year horizon (the maximum possible given the span of ALEC rankings).
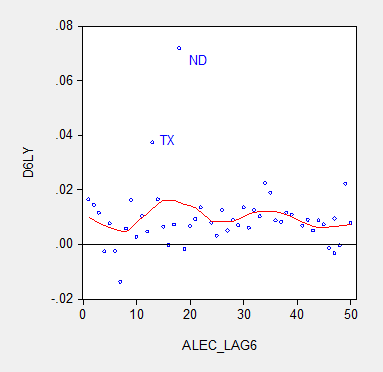
Figure 3: Average six year real Gross State Product growth (log difference) and six year lagged ALEC ranking for Economic Outlook. Nearest neighbor fit line (red), window = 0.3. Source: BEA and ALEC, Rich States, Poor States, 2015, and author’s calculations.
The nonparametric fitted lines indicate a slightly negative slope overall, suggesting some content to the argument that lower ranked states grow slower. In both Figures 2 and 3, North Dakota and Texas constitute outliers along the y-dimension. In order to discern how much these two observations drive the results, I omit them and replot in Figure 4.
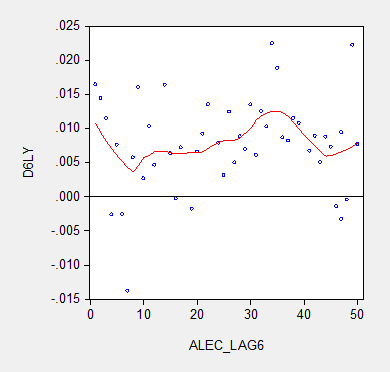
Figure 4: Average six year real Gross State Product growth (log difference) and six year lagged ALEC ranking for Economic Outlook, excluding North Dakota and Texas. Nearest neighbor fit line (red), window = 0.3. Source: BEA and ALEC, Rich States, Poor States, 2015, and author’s calculations.
No obvious pattern emerges from this last plot. In order to move beyond simple graphics, I now implement a series of regressions. First to a simple examination of the a bivariate relationship, encompassing the lower 48 states, one obtains at the annual frequency:
Δyi,t = -0.00003ALECi,t-1
Adj-R2 = -0.00, SER = 0.027, N=288. bold indicates significance at 10% msl, using heteroscedasticity and serial correlation corrected standard errors.
(I use the lower 48 as I do not have demographic and geographic data for the Alaska and Hawaii.)
Essentially, there is no explanatory power for the ALEC-Laffer indices in terms of year on year GSP real growth. Allowing for individual state-fixed effects, one obtains:
Δyi,t = 0.0004ALECi,t-1
Adj-R2 = -0.00, SER = 0.027, N=288. bold indicates significance at 11% msl, using heteroscedasticity and serial correlation corrected standard errors.
The coefficient is positive, indicating that lower ranked states, and hence states that have a less business friendly environment according the ALEC criterion, exhibit higher economic growth. The coefficient is borderline statistically significant. I would say that the use of state-level fixed effects is a fairly blunt way to account for state-specific factors. A better approach controls for state factors that economic theory suggests might be important for growth, such as geographic and demographic factors. Here we include log population density (LDENSITY, to account for urbanization), dryness (measured as inverse, WET), mildness of weather (MILD) and proximity to navigable waterways (DISTANCE); these four variables are defined such that positive coefficients are expected. These variables are time-invariant; hence one cannot estimate a fixed effects regression incorporating these variables. I also include log real price of oil (LRPOIL) to control for oil producing states, allowing the coefficient to vary across states.
Δyi,t = 0.0002ALECi,t-1-0.01LDENSITYi + 0.019WETi + 0.001MILDi + 0.0001DISTANCEi + LRPOILi,t
Adj-R2 = 0.36, SER = 0.021, N= 288. bold indicates significance at 10% msl, using heteroscedasticity and serial correlation corrected standard errors.
The ALEC ranking has no statistical significance, while a drier and more mild climate is associated with faster growth, with statistical significance. Proximity to navigable water is also a positive factor.
What if we estimate a comparable regression, looking at 6 year growth rates (but omitting oil prices which are the same for all states)? Then one obtains:
Δyi,t = -0.018 -0.0001ALECi,t-6 +0.001LDENSITYi – 0.0007WETi – 0.0003MILDi -0.00001DISTANCEi
Adj-R2 = -0.02, SER = 0.007, N= 48. bold indicates significance at 10% msl, using heteroscedasticity and serial correlation corrected standard errors.
Notice that the ALEC coefficient is not statistically significant. Thus far, the one case it has shown up as borderline significant, it goes the opposite of the ALEC-Laffer-Moore-Williams thesis.
Finally,Professor Ed (“no recession”) Lazear recently asserted that states with fast growing employment have low tax rates and right-to-work laws. He also argues that one needs to incorporate the depth of the drop in employment in 2008-09, in order to explain the growth in employment (so, a sort of version of the bounceback thesis he forwarded in the Economic Report of the President, 2009). I can’t find the working paper that provides the basis for his assertion, but I can estimate a comparable regression. In order to make the proposition testable, I examine 5 year growth rates in output, and refer to the ALEC rankings in 2009. I add the change in output from 2008 to 2009 (so TROUGHDEPTH takes on a value of -0.05 for observation i if output dropped 5% going into 2009).
Δyi,t = 0.065 -0.0010ALECi,t-5 +0.0046LDENSITYi + 0.0042WETi – 0.0014MILDi +0.00005DISTANCEi – 0.3413TROUGHDEPTHi
Adj-R2 = -0.04, SER = 0.037, N= 48. bold indicates significance at 10% msl, using heteroscedasticity corrected standard errors.
The ALEC variable does not exhibit statistical significance. Omitting ND and TX would not change this basic results. Moreover, the trough variable coefficient, while exhibiting the right sign, is not statistically significant.
Bottom line: The ALEC ranking, which purports to measure business-friendly policies, is not correlated with real GSP growth, either short term or medium term. This is true if one controls for additional variables.
I don’t think this necessarily means that policies such as right to work, or tax rates, and so forth do not have an impact on growth. For instance, Kolko, Neumark, and Cuellar Mejia, J.Reg.Stud. (2013) conclude that what’s important is “less spending on welfare and transfer payments; and more uniform and simpler corporate tax
structures.” Hence, the ALEC economic outlook ranking is, in my assessment, a manifestation of faith based economics.
Addendum: As Wisconsin has risen in ALEC rankings (33rd in 2008 to 17th in 2014), Wisconsin’s growth rate has declined relative to the US.

Figure 5: Wisconsin-US real growth differential (log first difference) and lagged ALEC ranking for Economic Outlook for Wisconsin (down is a “better” ranking). Light green shaded area pertains to GDP growth rates during the Walker era. Source: BEA and ALEC, Rich States, Poor States, 2015, and author’s calculations.
If it is not obvious, this is not the direction that ALEC-Laffer-Moore-Williams posit.
Note: Thanks to Professor Neumark, who kindly provided the data set used in his J.Reg.Stud. paper for use by my students in my PA819 statistics course (all students had to use his data set to analyze whether business conditions as measured by various indices (but not the ALEC ranking) influenced state level growth). The demographic and regional variables are drawn from that data set.
Bottom Line:
Stephen Moore is a liar. He will fit in perfectly at the Trump NEC.
I know a lot of people will say Kudlow is lying. But in truth he may be truly stupid enough to believe the garbage he utters.
I consider myself to be pretty perceptive about people (Maybe everyone views themselves this way??). But my sense is Kudlow knows he’s lying, but rationalizes in his mind that the lie buttresses better policies than would be had under “lefty” leadership. That being said, Kudlow is one of those complex individuals that it’s better not to try to figure out what is going on in his mind. Your odds are roughly the same on figuring out Kudlow’s thought processes as they are with Roseanne Barr or Kathy Griffin. I suspect this is why Kudlow is hitting the bottle again and getting people to give him pills, is deep inside he knows he’s in a game of prolifically lying for Trump, and that it’s not going to have a happy ending for him. There’s no way a guy with a Jewish brain inhabiting his cranium (although poorly utilized) can’t see something that is so blatantly apparent it’s screaming out in a hot pink neon sign in front of Kudlow’s face. If I was him I’d be downing however many 740ML liquor bottles I could and still be functional for meetings. You can’t have any sense of morality or conscience at all and not feel bad telling all the lies he is and will as long as he stays in that job.
Oh Menzie, there you go again. Using all that fancy-schmancy math stuff and all that bookish theory. You just don’t understand how the real world works. Everyone know…just knows, that what’s good for rich folks and big corporations must be good for the economy. Math and econometrics are socialist tools.
Lies suggest a presumption of knowledge that is unlikely he possesses. Lazy and ignorant who couldn’t care less is more likely, so yes, it is a perfect fit.
Menzie’s list of Stephen Moore’s many lies is hard to top. I’ll instead go back to a November 2002 National Review piece by Kudlow called the Deficit Dance which I have blogged on a few times with the latest version being:
http://econospeak.blogspot.com/2016/05/will-trump-do-kudlow-deficit-dance.html
Bottom line is that Kudlow wanted to show a yuuuuge full employment surplus in 2002 despite the Bush tax cuts so he took an estimate of the GDP gap but took six annualized flows and SUMMED them when he should have taken the average. I know kids in preK that could spot the error in what Kudlow did but apparently the idiots who read the National Review flunked preK arithmetic.
Kudlow probably had help from Donald Luskin. I doubt that either one of them on their own could sum six values.
Kevin Hassett is smiling a lot on some MSNBC interview right now trying to cover up for Kudlow’s lies. Of Hassett says that “Larry” is hopeful that economic growth will be enormous over the next decade and if his hopes pan out – we will see a lot more revenue.
What a load of BS. I guess the Cleveland Brown fans can hope they will go 16-0 in the regular season, make it to the SuperBowl, and win the whole thing. But don’t bet the ranch on it.
Hey, I’m hopeful that the lottery numbers I picked come up in tomorrow night’s drawing, and that I’ll have $200 million in my pocket. But I’m not going to base my household budget on it.
In the investment community there are a goodly number of people that want to believe this stuff.
So certain Wall Street research organizations hire people who will give them what they want to hear.
How do you think people like Kudlow got started?
“So certain Wall Street research organizations hire people who will give them what they want to hear”.
One would think a Wall Street research organization knows how to check http://www.bea.gov. I just did to see what real GDP growth was in 2018QI. It was only 2% per annum. Which means Kudlow lied about that. Do these research organizations know about http://www.bls.gov which shows that the employment to population ratio is still quite modest?
My point is simple – if these people trust Kudlow over real facts, I want to sell the stock of the companies short.
Yes, Hassett looks good compared to Kudlow and Moore (not to mention Navarro and some others in the admin), but even nice guy Kevin, who is powerless at CEA, coauthored “Dow, 36,000!” back in 1999. Still waiting on that one. Of course, even with that banana peel, his forecasting record looks better than Kudlow’s.
“It really does now look like President Donald J. Trump, and markets are plunging. When might we expect them to recover? A first-pass answer is never… So we are very probably looking at a global recession, with no end in sight.” — Paul Krugman of the New York Times the day after the election.
Here are some other really smart Trump predictions 🙂
https://www.investors.com/politics/columnists/and-the-hits-just-kept-coming-the-greatest-false-predictions-of-2017/
PeakTrader: This is not a discussion of forecasting. It is a discussion of facts. Are you defending Stephen Moore’s record on truth-telling?
Menzie Chinn, I think, Moore is sloppy, but I haven’t seen Krugman at dinner 🙂
And, I think, George Mason University, where Moore got his graduate degree, is one of the few schools that teaches Austrian economics. I also learned, it was the only college that had a part-time Ph.D econ course, at the time. Even the University of Montana didn’t have that.
“Austrian economics”
Hmmmm…isn’t that an oxymoron?
Like socialism and economics?
“And, I think, George Mason University, where Moore got his graduate degree”
It is Mr. Moore as he never got a Ph.D. Try an M.A. Which is cool compared to you who is struggling with pre-K.
PeakTrader I’m sure you had no intention of being dishonest, so let point out that you forgot to mention that a few days after he wrote that column he admitted he was wrong. When was the last time your or Trump admitted being wrong? But like I said, I’m sure this oversight on your part was unintentional.
“Moore — along with Kudlow, former Reagan adviser Arthur Laffer and billionaire Steve Forbes — is one of the early architects of the Trump campaign’s tax plan, CNBC noted.” from the Newsmax link.
I guess I should talk about the Four Stooges. The Trump campaign tax plan was idiotic. Good to see we are continuing with the same bimbo economic team Trump put together 2 years ago!
we are continuing with the same bimbo economic team
Now, now. You’re being quite unfair to bimbos.
Maybe we could start a game of matching members of the Trump economic team to the Four Stooges:
Moe: ???
Larry: ???
Curly: ???
Shemp: ???
I always did like 1984. War is peace a larger budget deficit is a smaller one, Canada has a trade surplus with the USA,
Trump big brother. it has a ring to it
Deficit reduction? Simple. Invade a Middle Eastern country and cut taxes a couple of times to finance the war. We’ll be welcomed as liberators, the wealthy will pay less, deficits will go down, and the debt will be gone by 2024 at the latest.
You sound like Kudlow 2003. Back then he predicted the invasion of Iraq would increase its oil production 4 fold and lower oil prices to $12 a barrel. How did that work out? Let’s ask Kevin DOW 36000 Hassett.
I could be wrong, pgl, but I think noneconomist is being sarcastic. But then we do see some really stupid and bizarre arguments coming out of CoRev and Peak Trader regularly here, so I could be wrong.
I would prefer satirical. But sarcastic will do.
noneconomist is definitely being sarcastic. He’s one of the smart posters.
Actually I got that he was being sarcastic. But he set up such a beautiful way of noting Kudlow’s great forecasting record!
A change in GDP or per capita GDP is often different than an improvement or deterioration in living standards.
Denmark’s per capita GDP is a little less than the U.S.. However, this is what one foreigner said:
“I live in Denmark and make what would be considered a high-end income in the USA, but I share a one-bedroom apartment with my daughter, we have no car, and we rarely dine out or eat takeout food. My tax burden is around 45% of my income, not counting the 25% sales taxes on most things that I purchase.”
Looks like government is raising kids in Denmark:
“Stay-at-home parents are unusual in Denmark, where the idea is that everyone who can work outside the home should do so, and children usually begin government-run day care when they are about a year old. Besides, the high income tax rates (up to 52% for earned income; the top rate starts at around USD$75,000 per year) make it difficult for one person to support a family.”
https://www.howtoliveindenmark.com/stories-about-life-in-denmark/moving-to-denmark-americans-us-passport-denmark-immigration-donald-trump/
And here I thought I was the only one who started drinking too early in the day.
They actually have an happiness index and Denmark did very well:
https://www.livescience.com/54066-happiest-countries-2016.html
Of course PeakStupidity had one too many vodkas and missed this.
Pgl, security is enough to make leftist losers like you happy.
You need cradle to grave government, and you call others stupid!
Pgl, why did you pick a 2 year old report? You should have actually read the report to know this is done annually. BTW under Trump do you which direction the US moved?
I’m really getting used to your commenting style. I might just continue to use it for you. 🙂
corev, peakloser routinely uses cut and paste quotes and data from a decade ago. i never hear your outrage when he presents his dated arguments. loser.
This is really funny – PeakConfusion whines that people in Denmark actually work. PeakConfusion probably does not get the concept since he is living off the government dole.
Peak Logic: Hispanics are socialists. Which means 64% of the residents of Tulare County–home base of Trump toadie Devin Nunes–are socialists!
Next door, 54% of Kern County residents are, in Peakthought, socialists. They’re there for all the freebies they can get.
What’s amazing is that the unemployment rate in Tulare is “only” 8.4% and in Kern County “only” 7.7%.
That must indicate thousands of these socialists are actually laboring on farms, in the fields, and on ranches rather than sitting around collecting. Must be because of all those “free” jobs they can get there. And the school-age kids must be taking advantage of all that free education provided in PUBLIC schools to everyone eligible to attend. There’s all that free medical care too.
Then there’s all that subsidized free food that Nunes and his guys want to limit , even though much of it has been grown with the assistance of government subsidies. In the last 23 years, Tulare growers have collected about $470 MIllion in ag subsidies, about $20.3 Million/year if you’re counting.
Remember those welfare queens driving Cadillacs? In Tulare and Kern, they been replaced by welfare kings in 4X4s.
Noneconomist, you’re good at fairy tales and bad at logic.
Actually, I suspect he’s living off the ill-gotten gains from various Wells Fargo scams. After robbing poor Hispanic workers he blames them for being poor.
2slugbaits, Congress created the scams and called lenders racists for not playing along.
A lot of people got homes, who normally wouldn’t qualify, along with personal ATM machines.
No one forced a poor Hispanic to get a loan. And, actually, a lot of homeowners defaulted on those loans and then lived in their homes for free.
Don’t be so naive and biased.
peak, rather touchy about your past work history? so we have a financial loser who contributed to the financial bust blaming the poor for the pathetic decisions of the banker robbers during their heyday. hey peak, why not grow up and accept responsibility for the damage you caused a decade ago. instead you sit back and collect your government welfare and rail against fellow immigrants trying to follow you into this country. what would jesus think?
Even funnier: “Pgl, why did you pick a 2 year old report? ”
Did CoRev put up a newer report? Of course not. He bitches about this stuff a lot but offers nothing.
The updated report!
https://www.cnbc.com/2018/03/16/these-are-the-top-10-happiest-countries-in-the-world.html
Denmark is ranked #3 but the US ranking falls to #18. So the update indicates US happiness is lower under Trump.
Thanks CoRev – your whining has bitten you in the rear end again!
Pgl, caught again doing sloppy research gets defensive and snarky. How infantile!
I do love using your style of commenting. pgl, especially back to you.
Why would I accuse you of sloppy research? Your latest reference is not to the 2018 version of your original reference. Now, how would I know that?????? Some times you just make it too easy to point out the weaknesses in your comments.
This from guy who is incensed about HIspanics (socialists everyone, don’t you know) coming here for a “free job”, one that averages out to an income of less than $20K/yr. in many instances.
About 1 in every 4 jobs in the San Joaquin Valley is directly connected to agriculture. Tomorrow most spots in the valley will be well over 100 degrees. If only, using Peaklogic, these people knew they didn’t have to do ANY work because, in PeakWorld, they can get everything for free!
Yeah, I’m the one who believes in fairy tales.
Noneconomist, yes, you keep proving you believe in fairy tales.
You know only one person from Denmark? I guess the rest of them see you and run the other way. BTW – most people in Denmark are happy. But you seem to be one very sad human being.
Pgl, you believe a bird in the hand is worth 10 in the bush, and you call me sad!
Another one of your dishonest pieces of spin is debunked and yet you continue with these childish rants? Oh wait – I did not mean to equate sweet little children with such a gas bag as PeakWhinyBoo.
And you believe that if the bird in the hand has flown in from Mexico, he’s looking for free bird seed, a free bird house for nesting, and free vet care when needed.
Yeah, I’M the one who believes in fairy tales.
peak is quoting from here without attribution or link: https://www.howtoliveindenmark.com/stories-about-life-in-denmark/moving-to-denmark-americans-us-passport-denmark-immigration-donald-trump/
He left out this part:
The pace of life is slower and less intense here, and people in general have a better work-life balance. Work begins at 8 and ends at 4 sharp, with no long lunches – Danes are focused.
Most jobs provide for six weeks of vacation per year, and you are not expected to be on call or answer emails during that time off.
And the Danish social safety net provides some relief when you are pregnant, sick, or unemployed.
Not all benefits are measured in dollars.
Ottnott, nothing is free:
“…the ‘free’ college promised in Bernie Sanders speeches is not ‘free’ for you as a non-EU citizen – you’ll have to pay tuition of around USD2000 per course, plus your living expenses, which are substantial in Denmark.
Actually, university in Denmark is not ‘free’ for anyone – it’s financed by punishing taxes, and not just taxes on rich people.
A person making $30,000 a year has an income tax rate of about 32% in Denmark, compared to about 15% in the US. There is also a 25% sales tax on almost everything you buy, plus an 85% tax on new cars. (Until a couple of years ago, it was 150%, and still is on high-end vehicles.)”
And, there seems to be a lot of work doing income redistribution, since 40% of full time jobs are government jobs. A $50,000 government worker pays 35% to 40% in taxes (not including 25% taxes on purchases) to maintain another $50,000 government worker, etc..
Ottnott catches you lying as usual and who do you do? Change the topic.
“peak is quoting from here without attribution or link”.
He does this routinely. Thanks for pointing out he has once again lied to us!
It is interesting that real income per capita in Denmark is very close to what it is in the US. Of course the American average is dragged down by free loaders like PeakyBoo.
Pgl, as usual, you don’t know what you’re talking about.
FRED notes real GDP per capita for Denmark is $60.6 thousand per year.
https://fred.stlouisfed.org/series/NYGDPPCAPKDDNK
PeakDishonesty says I do not know what I’m talking about? Lord Peaky – are you really THIS stooopid!
Pgl, only 10 small countries have higher per capita GDPs than the U.S.. Denmark isn’t one of them.
https://en.m.wikipedia.org/wiki/List_of_countries_by_GDP_(PPP)_per_capita
GDP and living standards can be much different, which I explained to you above and before. Yet, you continue to prove you’re a feeble minded simpleton.
“Pgl, only 10 small countries have higher per capita GDPs than the U.S.. Denmark isn’t one of them.
https://en.m.wikipedia.org/wiki/List_of_countries_by_GDP_(PPP)_per_capita”
PeakStupidity cites Wikipedia. Sorry dude – but my source was the FRED database.
“Pgl, only 10 small countries have higher per capita GDPs than the U.S.. Denmark isn’t one of them.
https://en.m.wikipedia.org/wiki/List_of_countries_by_GDP_(PPP)_per_capita”
PeakStupidity cites Wikipedia. Sorry dude – but my source was the FRED database.