“Energy regulation efficiency” and economic growth.
Last time, we turned to the Phoenix Institute for some mind-numbing, soul-killing “research”. Today we look to the Pacific Research Institute for some dumbfounding “analysis”.
This particular piece of research was brought to my attention by Patrick R. Sullivan, who is fond of quoting talking points from the MacIver Institute, the National Center for Policy Analysis, Cato, in addition to the Pacific Research Institute. The study in question purports to show:
The most interesting relationship is between a state’s [energy regulation efficiency] ranking and its economic growth rate. High ranked states on average grow faster than those ranked low. Moreover, the higher rate of economic growth is associated with faster employment growth. Energy regulation can, therefore, be an important factor in determining the eventual prosperity of a state.
The authors painstakingly compile indices for all fifty states; the indices and aggregate index are reproduced in all their technicolor glory in Table 16 from the study.
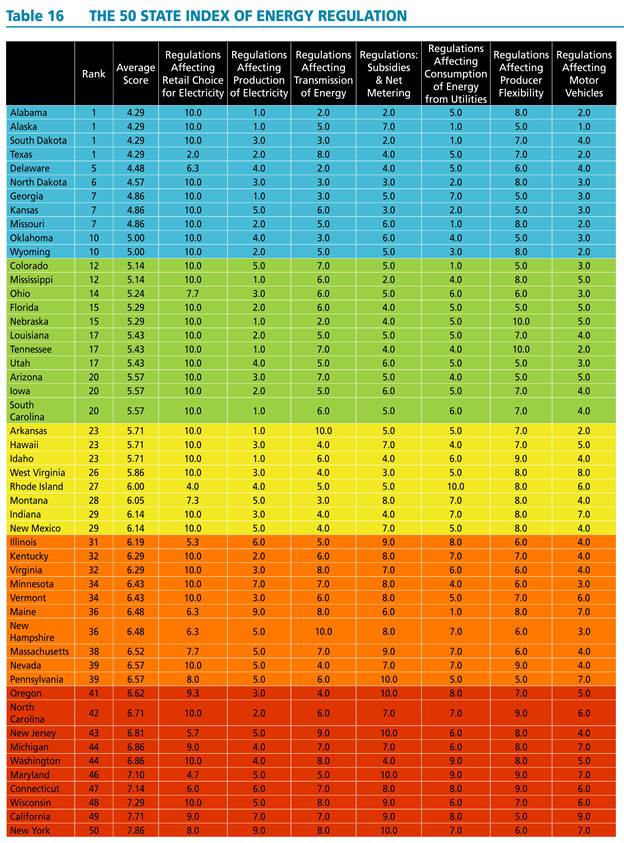
Source: The 50 State Index of Energy Regulation.
They then show the statistics for the quintiles for energy regulation efficiency ranking and growth, and note a positive correlation.
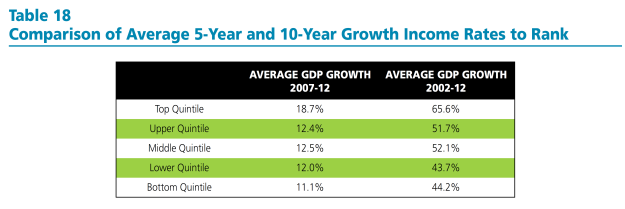
Source: The 50 State Index of Energy Regulation.
[NB: As far as I can tell, the authors have used the nominal growth rates of GDP, rather than real (which is pretty odd); the reported growth rates are not expressed in annual rates]
The document notes:
Interestingly, the strongest relationship to ranking is a state’s growth rate. High ranked states have faster growth rates than those ranked low. Table 18 below provides 5-year and 10-year growth rates by quintiles. The average growth rates for states within the quintiles follow a consistent trend. Over the 10-year period 2002-2012, states in the top quintile had on average cumulative growth rates that were more than 20 percentage points higher than those in the bottom quintile. The top quintile also had growth rates that exceeded those of middle three quintiles. The bottom quintile’s cumulative growth was lower than most of these other three.
The table and the text are notable for the omission of any discussion of statistical significance. At this point, any researcher worth his/her salt should hear the sirens going off. (The hand-waving in footnote 81 is also a tip-off, and also some cause for hilarity.)
If one estimates the regression analog to Table 18, using ordered probit, one finds that the relationship is not statistically significant at the 10% level for the ten year growth rate.
Of course, there is no particular reason to enter the dependent variable as a ranking (which requires the ordered probit estimation). One could just use the average growth rate (over ten or five years) as the dependent variable. Here are graphs of the underlying data.
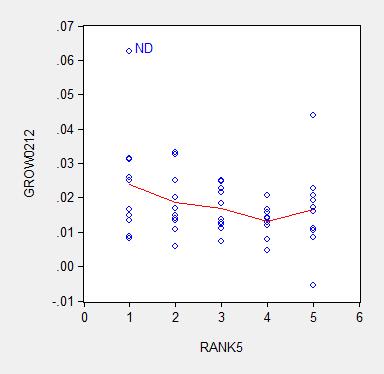
Figure 1: Average ten year growth rates 2003-13, by state, vs. Pacific Research Institute energy efficiency ranking (higher, such is 1, is “better” than lower, such as 5) (blue circles); nearest neighbor (LOESS) fit (red), window = 0.3. Source: BEA, Pacific Research Institute, and author’s calculations.
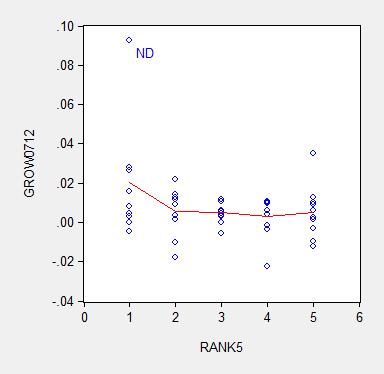
Figure 2: Average five year growth rates 2007-12, by state, vs. Pacific Research Institute energy efficiency ranking (higher, such is 1, is “better” than lower, such as 5) (blue circles); nearest neighbor (LOESS) fit (red), window = 0.3. Source: BEA, Pacific Research Institute, and author’s calculations.
I estimate the regression:
y = α + β×rank + u
Where y is an average annual growth rate, and rank is a quintile rank. Estimation using ten year average growth rates leads to:
y = 0.025 – 0.002×rank + u
Adj.-R2 = 0.05. bold face denotes significance at 10% MSL, using heteroskedasticity robust standard errors.
Using five year average growth rates:
y = 0.018 – 0.003×rank + u
Adj.-R2 = 0.06. bold face denotes significance at 10% MSL, using heteroskedasticity robust standard errors.
Notice that dropping North Dakota (ND) further reduces statistical significance. Moreover, any borderline statistical significance is obliterated by inclusion of a dummy for states with large oil reserves (top ten). I include a dummy variable into the ten year growth rate regression, and obtain:
y = 0.018 – 0.001×rank + 0.012×oil + u
Adj.-R2 = 0.20. bold face denotes significance at 10% MSL, using heteroskedasticity robust standard errors.
Notice that the adjusted R2 increases substantially with the inclusion of the oil dummy, indicating the minimal explanatory power associated with the Pacific Research Institute index.
In order to allow people to confirm the fragility of the correlation highlighted by Pacific Research Institute, I provide the data here (raw real state GSP data here).
It is astounding to me that an organization can spend all the resources to compile these indices, and yet not do the most basic statistical analysis taught in an econometrics course. It is even more astounding that some people take these results at face value. Apparently the aphorism that there is “one born every minute” holds true.
Is Pacific Research Institute an arm of the Heritage Foundation?
OMG!! Pacific Research is headed by an Ayn Rand clone: http://www.motherjones.com/politics/2012/07/sally-pipes-pacific-research-institute-keybridge-communications
Your conclusion made me google and I found that the US Government General Accountability Office issued a report about reports about reports that recommends the preparation of a report about the report about reports about reports.
REFERENCE: “Actions Needed to Evaluate the Impact of Efforts to Estimate Costs of Reports and Studies,” US Government General Accountability Office report GAO-12-480R, May 10, 2012
Seems like the link did not work, here it is again http://www.gao.gov/products/GAO-12-480R
Menzie,
Good article.
When I read the title I thought you were going to talk about a trip (pun intended) to Colorado.
We are observing perhaps the worst anniversary in US (and world) history. 43 years ago perhaps the worst president in US history, Richard Nixon, made that worst decisions by defrauding the whole world..
It’s that oil thing again.
I think energy regulation is part of a broader set of constraints on economic activities which are characteristic of places like California and the Northeast. In California, you have quite high electricity rates and gasoline prices, and certainly, that doesn’t help the economy there. On the other hand, the state is highly leveraged to high tech and (still) to media. These are not huge users of energy as a share of output.
In Princeton, we recently had a brouhaha over the potential for fracking in town, which has a laughable aspect to it. It was complete hysteria in decision-making circles, but it does illustrate a visceral and unwarranted revulsion towards oil and gas. No one in Princeton has a clue about fracking (but no one seems to object to the quarry located less than a mile from the township). On the other hand, NJ has low gasoline taxes, so go figure. I think the position of the state would change materially if we implemented offshore wind projects. The nominal plan for 3 GW would represent, say, $5 bn in subsidies from tax- or ratepayers, and I think that would have a notable detrimental effect on the economy, as it has in, say, Germany. But that’s not happening anytime soon.
I think the bigger issue in these states is the cost of housing, including real estate taxes. (And I’d add that long tail public pension obligations are going to make things even worse.) Even Krugman has acknowledged some of theses issues: http://www.nytimes.com/2014/08/25/opinion/paul-krugman-wrong-way-nation.html?_r=0
visceral and unwarranted revulsion towards oil and gas
That revulsion is *entirely* warranted. Oil is dirty, risky and expensive. . We need to leave as much hydrocarbon in the ground as we can.
People who are willing to forego income from producing and selling it are to be commended.
Actually, fracking for gas is not really that bad. Drilling involves trucks, equipment and noise, but that lasts only for a few weeks to months. You’re left with a wellhead and some piping, and something of the pad (a gravel or dirt area around the well suitable for bringing trucks in). Extractive industries don’t get much cleaner than that.
But, of course, you’re not going to frack for anything in downtown Princeton, just like you’re not going to install a tannery or slaughterhouse. Ain’t going to happen, partly for zoning reasons, partly because land is expensive in Princeton.
However, we have open fields not a block from the edge of the township. You could put a pad in there, easy. No one would see it, just as we don’t really see the quarry where we extract rock. And we do a good bit of that. Type “Trap Rock Industries LLC” into Google Earth, slide a bit north, and you’ll see an impressive quarry; slide just a bit south and you’ll see Lake Carnegie, where the Princeton crew team practices. The quarry is 3.5 miles from the gates of the University.
Now, there is resistance to the quarry, as The New York Times tell us. http://www.nytimes.com/1989/12/26/nyregion/new-jersey-towns-try-to-limit-stone-quarries.html And what does the story say? That townships are trying to limit quarry activities, except that the price of stone, as the story notes, doubles for every 20 miles of transportation. And that brings us right back to Menzie’s original story: That restrictive energy policies are limiting growth in California and the Northeast. The quarry is a good example.
By the way, don’t think we don’t have drilling in the neighborhood. At Princeton Academy, in the heart of the McMansion suburbs (and a mile from downtown) they drilled for geothermal energy just last year. Same stuff as drilling for gas. The tore up the front lawn, quite a mess. And now they heat with geothermal energy. (Thank you NJ subsidies! Elite schools should be subsidized for high cost heating by taxpayers.) And the stuff coming from geothermal vents is usually a good bit more toxic than natural gas. So, don’t think that we’re all that pure in Princeton. We’re only pure about things that are unfashionable.
We’re only pure about things that are unfashionable.fracking for gas is not really that bad….Extractive industries don’t get much cleaner than that…We’re only pure about things that are unfashionable.
That’s the superficial impact. Gas production & consumption releases green house gases (both methane, a powerful GHG, the release of which is generally unmeasured and unmonitored, and of course CO2). Oil, of course, has many more problems.
Climate Change is real, and a serious risk. That’s what scientists in general tell us. Look at the statements of every major professional scientific association: climatologists, physicists, geographers, etc., etc. Even the the American Association of Petroleum Geologists is willing to say that “AAPG supports reducing emissions from fossil fuel use as a worthy goal.”
And this in turn leads into some thoughts on regulatory and taxation externalities.
Let’s assume that the question of keeping the quarry open or closed (or approving fracking, for that matter), were put on the ballot in Princeton. (The quarry is actually in next door Kingston.) Now, would voters vote to keep it open?
They might not. Why? Because it is, by at least some measure, an environmental catastrophe (it’s a big hole in the ground) and it really doesn’t matter that much to the people of Princeton. How much more could rock cost if the quarry were closed? Well, the Trap Rock Quarry has sales of about $60 million; let’s assume that the loss of the quarry would raise the price of rock by 33%, or $20 million.
Now, there are probably 1 million people in the quarry’s service area, so the cost would be $20 / capita / year. That’s not too much, but in truth, the quarry has a pretty small psychological footprint in the community. Its effects are limited to some trucks coming out of the quarry, say, one truck every three to five minutes during busy parts of the day. It’s unlikely that nearby residents, in a new development well recessed from the access road, would pay $80 / household per year to avoid the trucks.
But what’s the loss of the quarry to the residents of Princeton or Kingston? Frankly, it’s minimal. So why not close it? Asphalt in the township might be more expensive, maybe a couple of hundred thousand dollars in increased township asphalting costs. But leadership in the township is unlikely to appreciate that costs would rise, and voters would appreciate it even less. So, from the township’s point of view, there may be upside than downside in closing the quarry.
So, who bears the costs of closing the quarry? Well, first and foremost, the quarry’s primary customer, the State of New Jersey, which has to pay $20 million more for asphalt. And another loser is the drivers of other parts of the state, where quarry truck traffic has increased (ie, the average quarry delivery trip will have increased as a result of quarry closure). Thus, Princeton Township would be externalizing the costs of quarry closure onto the broader community. Indeed, the closure of the Kingston quarry, even without consideration of financial costs (more expensive asphalt) would almost certainly lead to a loss of welfare for the region as a whole.
Thus, the highly educated and socially sensitive population of Princeton might not hesitate to externalize the costs of quarry closure and reduce regional social welfare in the interests of being “environmentally friendly” locally.
On the other hand, if these costs were internalized, then the residents of Princeton (or Kingston, as the case may be) would have to foot the bill for the higher costs to everyone else. How much would that be? Well, Princeton’s budget is $25 million, so a $20 million hit to taxpayers would be, let us say, a non-starter. The quarry would stay open.
However, the system as it stands permits such externalization. That’s exactly, for example, what the good residents of Connecticut have done to the users of I-95 in their state. It may be optimal for the environmentally sensitive citizens and the incumbent property holders adjacent to I-95 in that state to see its capacity restricted to 3 lanes each way. But the externalized social cost–I’ve recently seen east-bound backups from New Haven all the way to the New York border–is immense.
So, the folks at the Pacific Institute are almost certainly correct, notwithstanding concerns about statistical significance. And of course, the cost of such regulations can be measured in other ways as well, notably in electricity rates, gasoline prices and traffic congestion, to name a few. One can impute social costs from these, and these tend to be worse on the coasts (although Houston at rush hour is no picnic.)
I think it might be a mistake, however, to take a strictly red state/blue state interpretation of this things. Rather, settled states–and even more smaller political units like towns and counties–with high incomes and little experience with the natural resources business are more likely restrict energy or natural resources developments. I would not be thrilled at drilling in a neighbor’s back yard. But it is more to do with income and population density, I think, than ideology.
As I have noted before, governments are geared around Type I errors, preventing mistakes. Because there is no FAA, and a mixed and contradictory set of objective functions for decision-makers, Type II errors have almost no value (as Baffs has illustrated for us). If Princeton doesn’t have to bear the cost, its high-minded citizens may be more than willing to close the quarry, regardless of the broader impact.
it is, by at least some measure, an environmental catastrophe (it’s a big hole in the ground)…in truth, the quarry has a pretty small psychological footprint in the community. Its effects are limited to some trucks
This seems to greatly minimize the problems. The article talks about “day-to-day annoyances of living near a quarry like noise, dust, blasts and increased trucking.” (Trucking is only one of 4 things mentioned). Those are also external costs. Are the local citizens unreasonable? I don’t know, but I don’t yet see good evidence for it.
the highly educated and socially sensitive population of Princeton might not hesitate…high-minded citizens
This seems to follow a certain meme that environmentalism is an effete luxury. This inverts reality: pollution tends to be dumped on the poor, and the affluent have more power to defend their health. Nimybism can certainly become excessive, but often it’s vital..and often it’s inadequate to prevent serious pollution & health problems.
steven, if the princeton quarry closes another one opens 15 miles away in a less contentious location. your argument ignores the most likely outcome of all scenarios! your “externalized costs” disappear.
It’s New Jersey, Baffs, there are no “less contentious” quarry sites within 15 minutes. It’s all basically some version of sub/exurbia from Philadelphia to New York.
Nick – The quarry is quite clean on the outside. I’ve never seen dust. I can’t speak to noise. I don’t think the quarry works at night, during the day, it’s relatively isolated and has biggish roads around it. Trucks there are, though.
Again, there is no organized group opposing the quarry in any meaningful way of which I am aware. I don’t know that the average Princeton or Kingston resident has a huge beef with the quarry. I am rather using it as an example of energy-related policies, and people’s attitudes towards something which is in principle objectionable if you’re not used to it. They’d never get the permit for the quarry now; but given that it exists, it will continue to exist. And I’d bet it’s pretty profitable, given that the government has conferred a kind of monopoly on it.
In any event, if you see the attached story from the link, you’ll see that Princeton wants to be the first township in Mercer County to ban fracking. I burst out laughing when I read it. It’s as though they decided to ban the use of Koalas as skeet shooting targets in Princeton. Well, OK then.
I’ll get around to writing a piece for our Town Topics newspaper on fracking at some point. Have other fish to fry right now.
Here’s the story:
http://www.towntopics.com/wordpress/2014/08/06/new-ordinance-would-ban-fracking/
The quarry is quite clean on the outside. I’ve never seen dust… Again, there is no organized group opposing the quarry
Well, these two things are consistent: the quarry seems unobjectionable, and no one is objecting to it…
…I don’t know that the average Princeton or Kingston resident has a huge beef with the quarry. I am rather using it as an example of energy-related policies
But, if no one is objecting to it, isn’t it a story about how local government (sometimes, at least) handles such things reasonably well?
Princeton wants to be the first township in Mercer County to ban fracking.
Obviously, it’s symbolic. People there want to make a statement, and it’s a perfectly reasonable one. Personally, I’d *greatly* prefer a carefully calculated carbon tax, but sadly the oil & gas industry (in large part in the form of Koch activism over decades) has managed to demonize such taxes.
Let me say it again: Gas production & consumption releases green house gases (both methane, a powerful GHG, the release of which is generally unmeasured and unmonitored, and of course CO2). Oil, of course, has many more problems. Most hydrocarbons will need to be left in the ground.
Climate Change is real, and a serious risk. That’s what scientists in general tell us. Look at the statements of every major professional scientific association: climatologists, physicists, geographers, etc., etc. Even the the American Association of Petroleum Geologists is willing to say that “AAPG supports reducing emissions from fossil fuel use as a worthy goal.”
steven,
“It’s New Jersey, Baffs, there are no “less contentious” quarry sites within 15 minutes. It’s all basically some version of sub/exurbia from Philadelphia to New York.”
i disagree with you on this, but it is really beside the point. if everyplace is against the site, perhaps you are simply incorrect on the intrinsic value of the quarry and the externality costs. or fail to understand the willingness of locals to pay the premium for the quarry to be located elsewhere.
“Let’s assume that the question of keeping the quarry open or closed (or approving fracking, for that matter), were put on the ballot in Princeton. (The quarry is actually in next door Kingston.) Now, would voters vote to keep it open?”
interesting question, but upon further review i think you created a strawman argument without realizing it.
It’s not clear to me why you choose to highlight the statistical (in)significance of your coefficients here. You have the whole population–all 50 states, not a sample from a large population. Andrew Gelman and others have recently blogged about that.
Now, whether your estimates are economically significant is another factor all together.
I guess so many brain cells were killed that Menzie forgot the question I asked him about this. How DID he control for the differences in regulation between Minnesota and Wisconsin, when making his supposedly devastating critiques of Wisconsin’s failings?
Patrick R. Sullivan: In your eagerness to respond, you merely highlight your profound ignorance with respect to basic econometrics. Let me elaborate.
1. This post and the previous post on the ALEC-Laffer post, utilizing cross-section analysis, highlight the absence of statistically significant effects on economic growth of these proxy variables for regulatory and/or “pro-business” environment. Hence, no harm is done by not including them in my analyses of growth rates in Wisconsin relative to other states over the past decade.
2. Even if one were to take regulatory environment as important, the use of essentially differences-in-differences analysis (comparing growth rates pre-Walker against post-Walker, across states) eliminates state-specific fixed effects, which is appropriate if — as indicated in the various empirical measures we have — regulatory environment and/or “business environment” (as measured by say ALEC) are persistent.
So I suggest you go back, learn some statistics, before commenting again and thereby demonstrating for all your sheer ignorance. But if you want to provide more examples of your being out of your depth, please do.
Thank you once again for bringing my attention to the entertaining publications of the Pacific Research Institute.
I guess you didn’t get the memo from 1906, Menzie;
‘[I had] a growing feeling in the later years of my work at the subject that a good mathematical theorem dealing with economic hypotheses was very unlikely to be good economics: and I went more and more on the rules – (1) Use mathematics as a shorthand language, rather than an engine of inquiry. (2) Keep to them till you have done. (3) Translate into English. (4) Then illustrate by examples that are important in real life. (5) Burn the mathematics. (6) If you can’t succeed in (4), burn (3). This last I did often.’
It’s no great difficulty to use statistics like a drunk uses the lamppost; not for light, but for support.
Patrick R. Sullivan: Gee, and I thought we had progressed somewhat in economic discourse since 1906. Sincerely, instead of arguing on the merits of the statistics, you are now reduced to decrying the use of statistical methods. It’s not that I’ve used any particularly abstruse statistical analysis. It’s all in the introductory econometrics textbook for goodness’s sake. And regression analysis is in the introductory statistics textbook. I seem to recall having to take a statistics course as a requirement for college. Maybe your college education predates the adoption of that requirement?
So has anti-intellectualism extended to banning the idea of drawing lines through scatterplots? Is that what you are saying? That after all is the essence of the post (although I’m not sure you understood that point). The data I’m using is from the source you cited, so it’s not as if I made up the data.
I look forward to your next comment demonstrating your desperate flailing attempts to extract yourself from this bit of embarrassment. Keep it up! I’m sure I can use it for another post highlighting basic anti-intellectualism.
even if it were true, that would mean that states acting responsibly regarding climate, are still having to bear the pollution burden from the other states
if we had one of those republican invented cap and trade systems, then this would force the polluting states to send money to the non polluting states and the bottom lines should even out
Professor Chinn,
As always I appreciate your econometric offerings and the more detail the better for helping to increase brain cells. I especially like seeing both EViews input and output. I enjoy trying to duplicate your examples, but in this case the data links did not work for me. Was the data removed from the web?
Thanks
AS: Apologies, the links have been fixed now. Both files are XLS files.
Tom I don’t think Gelman’s comments apply here. First, note that the LOESS regression of growth (vertical axis) against ranking (horizontal axis) is not 1 thru 50, but 1 thru 5. In other words, the independent variable is the quintile bucket, not the actual ranking of the state. And of course there is some variance in the growth rates within each bucket. Secondly, in the case of an ordered probit model you probably would not use a 1 thru 50 ranking polychotomous dependent variable model unless you didn’t mind letting the intractable calculations run from now until Kingdom Come. The theory behind an ordered probit model is that there is some overlap and fuzziness across the categories. Fuzzy boundaries. Finally, in a probit model the error term represents the stochastic and unobserved latent tendencies that push an observation across some critical threshold separating the categories. So you definitely want to test for statistical significance. Moreover, you usually want to go beyond just testing for the statistical significance of the independent variables, you also want to make sure that the percentage distributions predicted by the probit model didn’t just happen by chance. There’s a test for that as well.
AS This is off the top of my head, but I don’t believe EViews has an ordered probit feature. I only recall seeing a binary logit/probit option. At least not one that’s contained in the menu. Of course, Prof. Green’s LIMDEP is big on limited dependent variables (hence the name “LIMDEP”). Menzie suggested “R” if you’re looking for free software. An ordered probit can be found in the “MASS” package. Lots of logit models can be found in the “mlogit” package (but setting up the data frames is kind of a hassle) and in the “multinom” command in the “nnet” package. Also, GRETL (also free) has an ordered probit model.
2slugbaits: EViews8 has ordered probit. Not sure about previous versions.
Okay, thanks. My version is a little out of date (EViews 7.1).
Professor Chinn,
Using the data for the 5 year model: y = 0.018 – 0.003×rank + u, I get the same coefficients and adj. R2. You mention, “using heteroskedasticity robust standard errors” 0.018 is significant at 10 % MSL (is MSL, mean significance level?). Also, (as a learning question) are you using the EViews “White heteroskedasticity-consistent standard errors & covariance”? I seem to get a different level of significance. (I’d bet you are correct, just a learning question).
AS: I think you’ll see significance level is slightly above 0.10, so I said fail to reject. Technically correct, but one could say “borderline” as well.
Significance disappears if one deletes outlier (North Dakota). If I recall, quantile regression eliminated significance, as well.
Could someone explain to me why the fixation on current growth rate? Just from memory, but if one were to compare incomes (say, median household income) between the states in the top and bottom quintile, the states in the bottom quintile (of the chart, as organized) look to have much higher current income than the states in the top quintile. Clearly, they have done something right to get where they are. If you believe in convergence, of course the poorer states have faster growing GDP.
Michael Cain: Theory suggests one should have convergence, internationally, and within countries. Well, the convergence club literature suggests otherwise in the international context. For within US, see Ganong and Shoag (2013), for instance.
I would agree with, Professor Chinn, that it is to difficult to draw a direct
correlation between the subject matter and economic growth..
What is needed, is a comparison of the top ten tax friendly (least tax burden)
and the top ten most taxed states…
Even then, a proper conclusion may not be reached. The Professor’s gang of four
(California, Kansas, Minnesota & BadgerLand) are all too inadequate in deducing
any concrete results…Moreover, this “study” would require at least a full decade in scope,
in order to find any cause and effect, if at all.
So, the PI study is very weak in any linkage, as is Professor’s four pack.
http://www.kiplinger.com/slideshow/taxes/T054-S001-10-least-tax-friendly-states-in-the-u-s/index.html
Hans: That’s why I did the ordered probit regression (that you commented on). Not quite ten years. But try this paper. At least they do the econometrics, which I applaud, rather than quoting talking points.
For some more obvious Oil/Energy/GDP relationships, see thought provoking figures by actuary Gail Tverberg at OurFiniteWorld.com. e.g. see how closely GDP tracks oil and energy supplies.
Energy and Economy – Twelve Basic Principles
Figure 8. Comparison of three-year average growth in world real GDP (based on USDA values in 2005$), oil supply and energy supply. Oil and energy supply are from BP Statistical Review of World Energy, 2014.
Oil limits reduce GDP growth – unwinding QE a problem
Note particularly the impact of high oil use and high increase on oil imports on Portugal,Ireland, Italy, Greece and Spain.
Figure 5. Percent energy consumption from oil in 2004, for selected countries and country groups, based on BP 2013 Statistical Review of World Energy. (EU – PIIGS means “EU-27 minus PIIGS’)
Percent Economic Growth 2005-2011
David,
Gail the Actuary is seriously detached from reality. She has a deep commitment to the idea that oil is mystically essential to a modern economy, and that Peak Oil is going to completely destroy modern civilization.
We have better and cheaper alternatives to oil, right now.
Nick G
References?
There is enormous potential in fusion.
Why are you not using it?
The price of oil dropped to $10/bbl in 1998 (~ $20/bbl average)
Now it is about $100/bbl.
Now is that >500% increase in the price of oil that due to an abundance of oil?
Or due to OPEC and increasing geophysical constraints?
Yes electricity is cheaper than oil. BUT how many cars run on electricity?
Have 99% of car owners shifted to electricity because it is cheaper?
Have 90% of car owners shifted to natural gas?
The dynamics of the transition are a critical factor.
The costs of replacement oil or alternative fuels are critical factors.
Why do more than half of all oil companies need >> $100/bbl to pay dividends and capex?
http://www.zerohedge.com/sites/default/files/images/user3303/imageroot/2013/04/Oil%20Cost%20Curve.jpg
David,
I agree that we’ve reached Peak Oil “Lite” – where we’ve switched to a seller’s market due to supply not growing as fast as “demand”.
But I think you’re asking, if substitutes for oil are so great, why they haven’t taken over?
Well, electric transportation is the best substitute. It’s growing reasonably quickly, but not as fast we’d like.
US pure EV sales have doubled each year for the last three years (from a very small base) and pure EV and PHEV sales are growing faster than hybrid sales did when they were introduced . Tesla has a large backorder book. Nonetheless, PHEV sales aren’t growing as quickly as many people had hoped.
Cost isn’t the problem.
Hybrids, EREVs and EVs are already the low cost choice for Total Cost of Ownership (per Edmunds.com), so if cost were the driver….we would have reached the tipping point. Buyers of new light duty vehicles (cars, pickups, SUVs) sales just don’t seem to be very price sensitive. The minimum cost US vehicle is about $11k, while the average vehicle is more than $30k. The average new car gets about 25MPG, while 55-100MPG vehicles are available. New car buyers just aren’t paying much attention to minimizing costs.
Supply isn’t the problem: Toyota, Nissan, Ford and GM will tell you that they could double production of their hybrids, EREVs and EVs literally overnight, if demand were there.
There are two big problems:
First, the vast majority of people are very slow to move to new things. Individual consumers have to see people around them using this new thing for quite a while to become comfortable with them. For example, online food ordering has overwhelming benefits for parents, but Webvan went bankrupt: they counted on people moving to a new thing too quickly.
Commercial users of heavy duty vehicles face large problems of economy of scale, long-lived investments and operating in a tough competitive market. Large fleet customers have been experimenting with pilot programs, but have been afraid of being first movers (“Pioneers are the ones with arrows in their backs”). That suggests that the early rate of adoption may be deceptive. At a certain tipping point fleet buyers will decide high oil prices are permanent, and that electrified/alt fuel vehicles are clearly cost justified. Then, sales will grow quickly.
Second, the primary reason for EVs is external costs like Climate Change and the cost of military conflict in the M.E., and as a society we haven’t prioritized dealing with those costs. We just haven’t. Until we do, with things like carbon and fuel taxes (which even the most conservative economists support for external costs) and acceptance by Republicans, it’s unrealistic to expect fast movement by consumers.
Professor Chinn,
At the risk of me seeming terminally incompetent, should the bold be shown on the -.003 rather than on the constant 0.018 in the five year model?
AS: I just re-ran the regression; the coefficient on rank5 has a t-stat of -1.60, p-value of 0.116 — so not statistically significant at conventional levels. I think it should not be in bold. In contrast, p-value on constant is 0.025, so constant should be in bold.
Professor Chinn,
I got the t stat of -1.60 on the rank5 and a t stat on the constant of 2.3, so I I see that the constant is significant. Sorry for the confusion. I guess that since the constant is significant at the 0.025 level and the coefficient of the rank5 is significant at the 0.116 level(not significant at conventional levels, as you say). I thought you were referring to the rank5 coefficient when you said the bold signified the 10% significance level(10% being closer to 11.6% than to 2.5%). In short, I agree with your numbers, but was confused about the “bold” comment. Thanks.
It seems if one were to assume that the Pacific Research Institute is trying to honorably and objectively report research results, someone should share criticism of the institute’s methods with them so the researchers may correct their methods. In the spirit of reasonable people can disagree, it may be beneficial for the institute to report reasonable research results to contrast with different opinions held by others.
It may be based on too much qualitative data.
Not all types of regulations are the same.
And, they don’t have the same effect, on growth, in each state.
Some states can absorb regulations better than others.
Great job Menzie, sorry you put yourself through all that. These MacGoober Institute ranking “analyses” are always set-up jobs, where the Fix is in and the outcome already dictated by the design of the research (why isn’t there an academic court set up where PhDs who perform this kind of shoddy work can be stripped of their degrees?).
Let’s just look at one aspect of this “study”:
In determining the score for Motor Vehicle Regulations, the authors of this garbage use the following items:
First, the higher the gas tax, the higher (worse) score a state receives. The score can be from 1 to 5 depending on the level of state gasoline taxation.
“Second, the remaining five subcomponents of this index are based on whether the state implements the
policy (which adds an additional point) or not (no additional point added).75 These five subcomponents
are:
• Prohibition of self-service gasoline stations
• Additional renewable fuel standards
• Idling regulations
• Emission and air quality standards, and
• Acquisition or fuel use standards”
So by having a well-funded highway construction program you lose economic efficiency? Have the authors of this study bothered to consult with the equally-conservative American Road and Transportation Builders Association? I’m pretty sure they have equally impressive economic studies showing how states without well-funded transportation funding are doomed to economic despair. And a truck idling regulation counts against economic efficiency as much as an additional 15 cents in gasoline taxes.
You see the “real” analysis is that any and all regulations are evil, roads will build themselves, and to quote the “study”: “While the goal of increasing air quality is
noble, from an economic efficiency perspective resources have been diverted from where they are more productive. So, if the vehicles are subject to such laws, the state receives a point,” which infers that clean air has no economic efficiency, no productive impact.
This study is a joke and merely a yet another (in a long, endless, tiring and extremely well-funded) in a series of studies that show who we’d all be better off without any laws, regulations, or restrictions whatsoever.
Here in California, my vehicle failed emissions this year, although it’s a 2006.
After paying for the emissions test (about $100), which the state receives part of the money, I went to the DMV (and waited for hours) to pay my registration for this year (over $200), but didn’t receive a 2014 sticker for the license plate, since I failed emissions (I had to renew my license too, which cost $72, and couldn’t go to triple A to save lots of time waiting, since they don’t renew drivers licenses).
So, now I have to pay to fix the “problems” (who knows how much they’ll cost) to pass emissions and pay for the emissions test again. If I get pulled over by the police, in the meantime, I may be in trouble and have to pay.
What a racket.
peak, apparently you did not live in LA in the 80’s. no worries, just take a look at beijing today to understand why california (and many other urban areas around the country) have applied a cost to particulates in the environment. you can ride a bike if you don’t want to be bothered with particulate pollution costs.
Without that “racket” you would be forced to invest a few hundred dollars into an effective re-breather, or personal air filtration system in order to avoid the same level of pollution related disease as prevails in China. A couple hundred sounds like a bargain to me.
Dr Morbius, thank you so kindly for your objective support of statism.
Baffling, Dr. Morbius, and Spencer, so, you all believe it’s worth the money, time, effort, and aggravation of millions of Californians to make their vehicles 99.5% cleaner than 99% cleaner.
Not all Californians can afford the highest emissions standards in the country. There are opportunity costs.
If California wants to limit the number of vehicles, on the road, or create lots of illegal drivers, it’s probably doing a great job.
And, by the way, I got my first estimate to “fix” my vehicle today – $585 (it didn’t meet two of the around 15 standards).
peak
“Baffling, Dr. Morbius, and Spencer, so, you all believe it’s worth the money, time, effort, and aggravation of millions of Californians to make their vehicles 99.5% cleaner than 99% cleaner.”
actually you are incorrect in the cost of the additional 0.5%-simply hyperbole in trying to make your argument. and yes, it is worth the extra cost to eliminate the auto pollution which would otherwise provide health hazards to the region. just like it was worth the effort to eliminate the pollutants causing acid rain in the 1970’s. or the pollutants that filled the great lakes, especially lake erie, in the 1960’s.
all you need to do is be stuck behind a car with its catalytic converter removed to understand why we have these rules in place.
you also need to realize many cars throughout the country already have the California emissions standards built in-you are not the only one with this requirement. and i also have to pass an emission test. if a component fails in my vehicle, i have to get it replaced just like you do. your need to “fix” this is not unique to california, it is nationwide.
What do you drive? According to efficient market hypothesis you must have considered repair and other costs at the time you purchased it. There are low-emission vehicles available.
Peak Trader probably is not old enough to remember how bad the “smog” problem use to be in California.
It came largely from auto and they have been substantially reduced by the regulation that he finds to be a problem.
Spencer, the O Zone hole is still as big as ever, despite regulations..
I will admit, I was wrong about emission controls on vehicles.
hans, doesn’t it make you curious about what else you have been wrong about?
Your Baffling:
I have been more wrong than you have been right..
“Peak Trader probably is not old enough to remember how bad the “smog” problem use to be in California.”
Ah!!! Walking to school in 1948 in the rain of soot particles from the “smudge pots” burning to heat the groves in freezing weather. Back yard incinerators where banned shortly there after, at least when I returned in 1955. Damn regulators getting in the way of the “job creators”.
Rule of thumb – anytime you see a ranking like this with Kansas in the top tier and it isn’t measuring sheer incompetence then it is a complete joke. The mere fact that regulations against idling is considered a bad thing is irrational. Around here a lot of those regulations come from pressure from the unfortunate people who live near the big box stores and have to put up with the health hazards of idling diesel trucks 24/7 – and last time I checked idling saved fuel. Not sure what their problems with utilities are but we have been(too slowly) attempting to get rid of the Centralia Steam Plant. Some 40+ years ago when it was being built in the county I grew up in the local rag assured its readership that the plant would be “Polution Free” – it became the single largest point source of pollution in the State of Washington. It eventually became a plant in which we got the pollution, a foreign company got the profits and California got the power. Great deal eh! We do have a high gas tax as the state is rather a difficult to built highways in – just getting goods shipped out of Seattle east requires going over a large lake and a mountain pass. Both have large road/bridge projects going currently. I guess we should have just stuck with the old Indian trails. Also a ferry system which seems to beat either rowing or swimming.
oops – not idling saves fuel.
Americans and their cheap energy entitlement…. sigh.
As long as the USA sticks to the lowest dirty fuel excise taxes among the rich OECD countries, all is good in my universe.
I would also like to mention how happy auto emission regulations make an upstream sector oil investor like me.
And please do blame the oil companies for everything. That way ordinary voters do not have to take responsibility and re-think their entitlement attitudes.
Stay the course!