This headline “US Recession Imminent – Durable Goods Drop For 5th Month, Core CapEx Collapses”, following on “Forget Recession: According To Caterpillar There Is A Full-Blown Global Depression”, impelled me to check to see if I’d missed something.
Term Spreads
The first thing that I wanted to inspect was the term spread, in this case the 10 year-3 month spread.
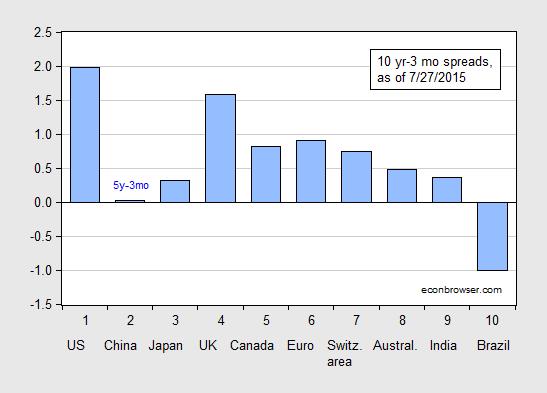
Figure 1: Ten year-three month term spreads, as of 7/27/2015 (blue bar). China observation is Five year-three month term spread. Euro ten year rate is for Germany. Source: Economist accessed 7/27/2015, and author’s calculations.
Interestingly, the US spread is larger than it was in April when I last examined the spreads, which seems to suggest that a US slowdown is not imminent. Of course, there is no guarantee that in an era of zero short rates, quantitative easing and (over an even longer period) foreign central bank purchases of long term Treasurys, the traditional correlation between spreads and growth (and recessions) hold. The only other country with a negative spread is Brazil.
Since the levels of the short rate are also important for predicting recessions, as reported in just-published Chinn and Kucko (2015) (Table 6), I also present the underlying short and long rates in Figure 2.
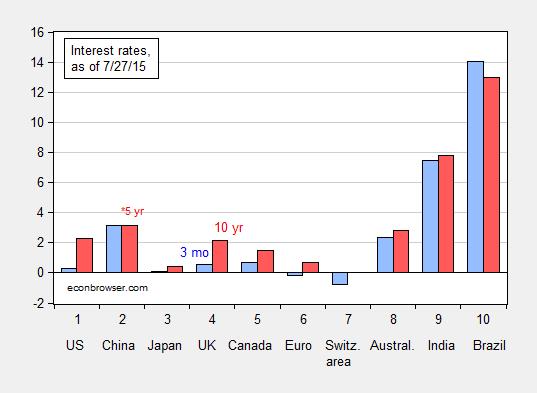
Figure 2: Three month term interest rates (blue bar) and ten year interest rates (red bar), as of 7/27/2015 (blue bar). China long term observation is Five year interest rate. Euro ten year rate is for Germany. Source: Economist accessed 7/27/2015, and author’s calculations.
Hence, while spreads are currently positive in most countries, short rates are also high, and particularly so in Australia, India and Brazil.
Now, shrinking spreads usually signal slower growth six to 12 months ahead, at least in the US context, so it could be that the spreads were signalling earlier the imminent recession. I don’t off-hand have those spreads from six to 12 months ago, but I did record the spreads in the post back in April, about three and a half months ago. Figure 3 repeats the relevant graph.
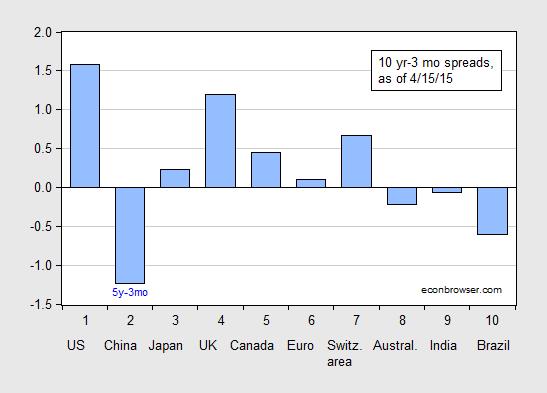
Figure 3: Ten year-three month term spreads, as of 4/15/2015 (blue bar). China observation is Five year-three month term spread. Euro ten year rate is for Germany. Source: Economist accessed 4/15/2015, and author’s calculations.
Back then, China, Australia, India and Brazil all recorded inversions, although as I mentioned at the time, there was little statistical evidence I knew for the predictive power of term spreads in these countries. As it turns out, slowdowns — although not necessarily recessions — did manifest in China and Brazil.
Interestingly, the yield curve did not invert in Canada, either in April (as shown in Figure 3) or before; nonetheless the country has just recorded one quarter of negative growth (-0.6% SAAR in Q1). The closest to inversion was +0.75% in January 2015. But then, in Chinn and Kucko (Table 3), we didn’t find evidence that the Canadian spread predicted growth in the 1998-2013 period.
Real Indicators for the US
At this juncture, I think it is useful to examine the data. Figure 4 depicts five key indicators examined by the NBER Business Cycle Dating Committee for identifying peaks and troughs: nonfarm payroll employment, industrial production, personal income ex.-transfers (Ch.09$), manufacturing and trade sales (Ch.09$), and monthly GDP from Macroeconomic Advisers (Ch.09$). I normalize on the end of 2014 as that is the peak in industrial production.
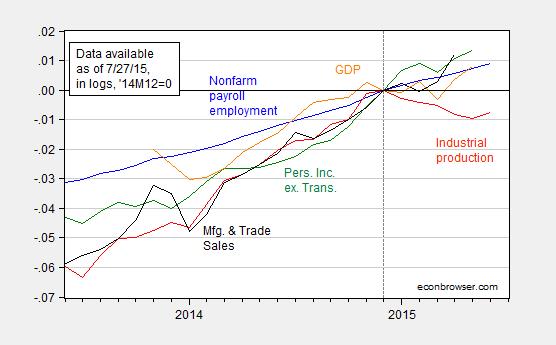
Figure 4: Nonfarm payroll employment (blue), industrial production (red), personal income ex.-transfers (Ch.09$) (green), manufacturing and trade sales (Ch.09$) (black), and monthly GDP from Macroeconomic Advisers (Ch.09$) (orange), all seasonally adjusted, in logs normalized to 2014M12=0. Source: BLS, Federal Reserve Board, BEA, Census/FRED, Macroeconomic Advisers, and author’s calculations.
While industrial production is 0.7% (log terms) below peak, the other series are as of latest recorded data still rising. Since the later observations will be revised (which is why the NBER BCDC waits months to make decisions), one would not want to “pull a Lazear” or (heavens forbid) “pull a Luskin”, and assert “no recession imminent”. However, at the moment, growth — albeit slow — seems the likely outcome for the US.
However, for my taste, the slowdown in industrial production (and manufacturing) is worrying, and given the persistent strength in the dollar, one would not want to be too complacent. To the extent that policies can be implemented to keep the dollar from appreciating further, they should be.
The World?
World trade volumes have taken a bit of a dive, and some have taken this to mean a global slowdown. Does this signify a recession? The answer to this question hinges upon the extent the trade slowdown in the wake of the global financial recession is structural (e.g., less deepening of vertical specialization) or cyclical. There’s some debate in Chapters 1-3 in this VoxEU volume.
The July World Economic Outlook update doesn’t predict a global recession, but it certainly highlights downturns in certain areas (2015 q4/q4 growth in Latin America/Caribbean is forecasted at -0.1%, while Russia is slated for -4.8%. China is forecasted for 6.8%, down from 7.3% in 2014.
That being said, it’s an open question how resilient East Asian growth will be to a more than anticipated deceleration in growth. Then, prospects for a global recession depend a lot on how a global recession is defined — a marked slowdown or an actual decrease in global output.
I find Zero Hedge pretty good in a downturn, because everything is pretty much as bad as it says. However, ZH continues in the same vein in an upturn, and it’s consequently been unnecessarily hysterical in recent time, in effect the National Enquirer of the finance world. So I tend to check ZH and then see what the substance of the story is at Calculated Risk. I can’t tell you how important McBride has become in my daily monitoring of the US economy.
Right now, the question on everyone’s mind (by this, I mean people invested in oil) is whether China is going to falter. There is widespread fear of a reprise of 1998, which would swing oil consumption by as much as 1.5 mbpd for the Asia Pac region (from about 900 kbpd growth to 600 kbpd decline). Consequently we’re getting crushed in oil markets right now. I have personally referred to the current situation as La-La Land. (http://www.cnbc.com/2015/07/23/as-crude-gets-crushed-traders-play-for-40-oil.html) Oil prices are comfortably $15-20 / barrel below marginal cost, and that’s assuming shale can pretty much provide all necessary incremental oil for the indefinite future. But investors are looking at news just now, not fundamentals.
It’s a fascinating time to be in oil. For example, at present we have a global shortage of gasoline, and a global surfeit of diesel. Why? Because Chinese consumers are buying gasoline like crazy, as are Americans. But diesel is also a by-product of the refining process, and demand for this is growing more slowly than for gasoline. So we have a diesel glut. Implication: the US and China cannot be on the same fuel standard. Traditionally, the Europeans have been on a diesel standard for vehicles, the US on a gasoline standard. If the US and China both want to be on a gasoline standard, then the barrel will be unbalanced. Diesel will go begging. It’s fascinating stuff.
So, if you’re car shopping, you might consider a diesel. It could be a good bit cheaper than gasoline for some time to come.
We have two diesel trucks. Happy to hear the price reduction. However they don’t get many miles per year.
The real surprise was the price of propane!!!! Yikes! Less than a dollar a gal here in the far reaches of the Gamma Quadrant.
Just posted: 0.88 per gallon. At one time it was equal to gas prices. Anyone got an idea why the fall in price?
My son just bought a loaded F-250 turbo-diesel and is just sooo happy with the fuel prices right now. And he got a great deal on the truck.
Can someone explain to me why someone with more than half their brain intact would read zerohedge, let alone take it seriously? It’s clickbait entertainment.
I take zerohedge about as seriously as the woman who walks around campus with the “World ending in 3 days” sign. One day, she might be right…
Only about half my brain is intact. However, I check out ZH, as I do Drudge, to see what’s out there in the ether. Durden has been very good about breaking some stories otherwise ignored in the MSM. You don’t have to take it as gospel. It’s a starting point.
Durden’s problem is the same as CNBC’s: It’s a cyclical business and he has to get eyeballs for his ever-growing list of advertisers. (No, I’m not interested in iShares.) So there is a premium on sensationalism. He sees what kind of stories draw readers, and he will tend to produce those sorts of stories. There’s no need to take it so seriously.
On the other hand, the two Tylers are probably the hardest working bloggers out there.
Historically, during debt-deflationary (balance-sheet, slow-motion depression) regimes of the Long Wave (where the world is today), the yield curve DOES NOT INVERT prior to recessions and bear markets. For the best data available for long and short rates, including for the US, UK, France, and Germany, recessions/depressions occurred without yield curves inverting in Japan since 1992, in 1931-54, 1893-99, and 1837-47 (1854 in the UK).
Recessions do not occur because of lending constraints per se but because of weak household and business income during a period during which the rate of real GDP per capita has slowed to a secular low for 50-60 (70+ years in our case today, owing to increased lifespan extending the Long Wave rhythm).
http://meritocracycapital.com/wp-content/uploads/2015/06/NDR_recession_model_2015-06.png
Ned Davis Research’s GRPM suggests that the global economy entered recession in Q4 2014-Q1 2015, which is confirmed by my work in the case of the cyclical change rates of the real per-capita sum of profits, personal income, and gov’t receipts (proxy for final sales ex net exports and gov’t spending) having decelerated to “stall speed” in Q4 2014 on a 4-qtr. basis.
Recall that the US stock market did not roll over and crash until 2-3 quarters AFTER recession began in Q4 2007, Q4 2000, and Q2 1990. Therefore, the stock market is NOT a “leading indicator” or even a coincident indicator but a “lagging” indicator of the economy. QEternity, ZIRP, and financialization, however, has resulted in the stock market de facto being “the economy”.
Also, adjusting money supply data for the accumulation of a huge amount of cash assets/reserves on banks’ balance sheets, M2 plus institutional money funds and large time deposits is no higher than in 2007.
Thus, the real M2 and stock market components of most leading indices will not serve as leading indicators of the business cycle during a debt-deflationary regime of a Long Wave Trough as they do during the inflationary/reflationary growth phases.
As such, we should see the economy exhibit cyclical “stall speed” and federal gov’t spending to GDP and the fiscal deficit begin to rise hereafter coincident with recessionary, or recession-like, conditions. The Fed will NOT raise the reserve/discount rates under these emerging conditions; or, if they do, they will quickly reverse course and resume QEternity to fund increasing fiscal deficits and not unlikely bail out banks’ busted shale loans, subprime auto loans, bank and insurer stocks, and mortgage debt.
The world is becoming Japan, as will/is China, with the Middle Kingdom having reached the “middle-income trap” with massive debt to GDP at the point the US was in 1930 in real GDP per capita.
It’s a once-in-a-lifetime, slow-motion depression of a Long Wave debt-deflationary regime, gentlemen, as during the 1830s-40s, 1890s, and 1930s-40s (early to mid-1950s in Europe). Demographics, a record low for wages to GDP, and unprecedented debt to wages and GDP imply that the slow-motion depression will persist into the early to mid-2020s.
History and math informs us that the only way out is a debt jubilee; a 50% decline in equity values that persists; ceasing regressively taxing earned income (including self-employment) and favoring levered rentier speculation; increasing wages to GDP; and shifting gov’t spending from never-ending imperial wars as economic policy by other means to job- and purchasing power-generating, productivity-enhancing infrastructure investment for the 21st century.
But these prescriptions are the antithesis of what Wall St., The City, Frankfurt, DC, and Westminster advocate as part of the neo-liberal, military Keynesian consensus and money-for-nuthin’ rentier speculation and financial bubbles as policy.
So, prepare for another recessionary downturn and renewed QEternity to fund $1 trillion/year deficits as the Long Wave slow-motion depression persists along with the end game for the post-Bretton Woods regime and for the Anglo-American imperial trade regime, i.e., “globalization”.
Very interesting BC.
ONLY TIME WILL TELL
Your to early. The oil extraction bubble wasn’t big enough. Your mumbling a storm with no real content.
I use the CRB:Index of Raw Industrial Prices as an indicator of world growth.
The change in this index has over an 0.8 correlation with the change in world industrial production as compiled by :
NETHERLANDS BUREAU for ECONOMIC POLICY ANALYSIS
http://www.cpb.nl/en/world-trade-monitor
It is also a great leading-concurrent indicator of oil prices.
Since the start of the month the index has been in free fall and is now back to it’s levels of the 1990s.
It is clearly waving a red flag about the world economy.
I have been telling my clients for months that the greatest market risk is disappointing earnings, not rising rates.
earnings were disappointing in 1995 as well. tell you clients to follow they money.
Actually, the correlation between the change in the S&P 500 and the change in S&P 500 EPS is essentially zero.
Zerohedge is a Rothschilds front. Nothing more or less. They wan to break the Morgan/USD alliance and regain control of the monetary system. Lets remember 2 things:
1.GDP will likely be revised up from 2010-14 due to the oil extraction bubble due to money chasing after price
2.GDP will slow from that revised level in 2015.
Milton Friedman called these “microrecessions”. Sounds like to me the next bubble is going to blow up. Follow the money.
It looks to me like the Fed is blowing another bubble in the US housing market. It’s time to raise rates.
http://www.calculatedriskblog.com/2015/07/real-prices-and-price-to-rent-ratio-in.html
Steven, the housing bubble by the following data (real median house price vs. real wages and salaries per capita) is about two years old by now, is larger than those in the late 1970s and late 1980s, and as large as the one in 2004-07:
https://research.stlouisfed.org/fred2/graph/fredgraph.png?g=1x6E
The 3- and 6-month YoY average rates for Redbook’s survey data (proxy for retail sales ex autos and gasoline) are at the slowest rate since fall 2008 to winter 2009 (and no real growth per capita YoY):
http://www.investing.com/economic-calendar/redbook-911
This is confirmed by UPS’s assessment of the US economy:
http://www.marketwatch.com/story/ups-fires-warning-shot-across-the-bow-of-the-stock-market-and-the-fed-2015-07-28
Plunge in CC:
http://www.investing.com/economic-calendar/cb-consumer-confidence-48
Gallup’s CC:
http://www.gallup.com/poll/184361/economic-confidence-index-continues-downward.aspx
Trade is not growing:
http://www.cpb.nl/en/number/cpb-world-trade-monitor-may-2015
Ned Davis Research’s GRPM has the global economy entering recession in Q4 2014:
http://www.cmgwealth.com/wp-content/uploads/2015/07/7.8.2.png
It’s WAAAAAY too late for the Fed to raise rates. As the US economy continues to decelerate towards the post-2007 trend for real final sales per capita of ~0% and cyclical “stall speed”, the Fed is much more likely to resume QEternity to fund the increasing fiscal deficit/GDP later this year or by early 2016.
The Fed/TBTE banks’ pumping up unprecedented leverage (50-80:1?) via their shadow banking offshore pass-through entities in the Caribbean banking centers, Channel Islands, “Belgium”, and elsewhere puts the global banking and financial system in a condition of vulnerability surpassing that of 2006-08. Were the Fed to raise the funds rate at this point and hereafter, they risk a potentially catastrophic disruption to the term structure and a global derivatives and debt-deflationary implosion that will exceed the 2008-10 crisis.
The Fed, TBTE banks, and Wall St. via “forward guidance”, QEternity, and ZIRP in attempting to avoid an 1890s- and 1930s-like debt-deflationary collapse have encouraged runaway leverage to the extent that the risk is now even higher that what they have tried to avoid will eventually occur with predictable results, requiring still more of the same that creating the outsized risks in the first place.
This is a quietly desperate end-game scenario that is unlikely to resolve pleasantly.
But none of this is new or unknown; rather, it simply cannot be said publicly. When the facts and implications cannot be publicly acknowledged and discussed, someone is benefiting disproportionately from the omission, deceit, or obfuscation at the expense of everyone else.
Therefore, it’s not hard to discern who wins and who loses under the circumstances, only what the price the losers will have to pay this time, and whether or not the system can avoid collapse as a result. I’m not so sure . . .
to quote Indian and Brazil rates in local currency is misleading , try euro nominated bonds
genauer: What currency your quoting in depends on what you’re trying to get at. If it’s default risk, then I’d agree that one might want to look at the dollar spreads. If one is trying to get at how the term premium correlates with subsequent economic growth, one might very well want to look at rates in domestic currency, particularly as more internationally traded domestic currency denominated debt has been issued.
Here’s Greenspan lamenting just that deficit bias which I routinely harp on.
The problem is that our national debt is huge, but the current deficit is manageable, so there is very little pressure to reduce it. This is just to highlight the importance of an FAA (bonus plan for politicians). If we had an FAA, fiscal policy would be materially different today.
http://video.cnbc.com/gallery/?video=3000401737