The 2016Q3 GDP advance figures were released today, indicating a 2.9% growth rate (SAAR), exceeding consensus (Bloomberg 2.5%). Tomorrow, Jim will report on the recession probabilities based upon the advance release (see last quarter’s analysis here). Until then, given all the discussion of recession (e.g. [0], [1]), it seems useful to show a few pictures of where we stand today, and the outlook going forward, given some standard and non-standard indicators.
Here’s the official GDP series and two monthly series.
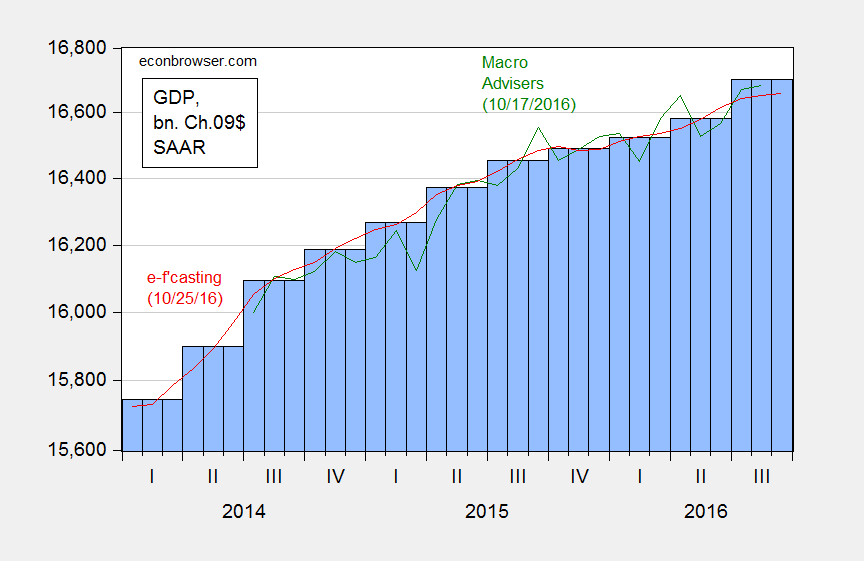
Figure 1: Real GDP in bn. Ch2009$ SAAR, from advance release (blue bar), Macroeconomic Advisers (green), e-forecasting (red). Source: BEA, Macroeconomic Advisers (17 Oct), e-forecasting (25 Oct).
Five key indicators the NBER Business Cycle Dating Committee (BCDC) have in the past examined are depicted below.
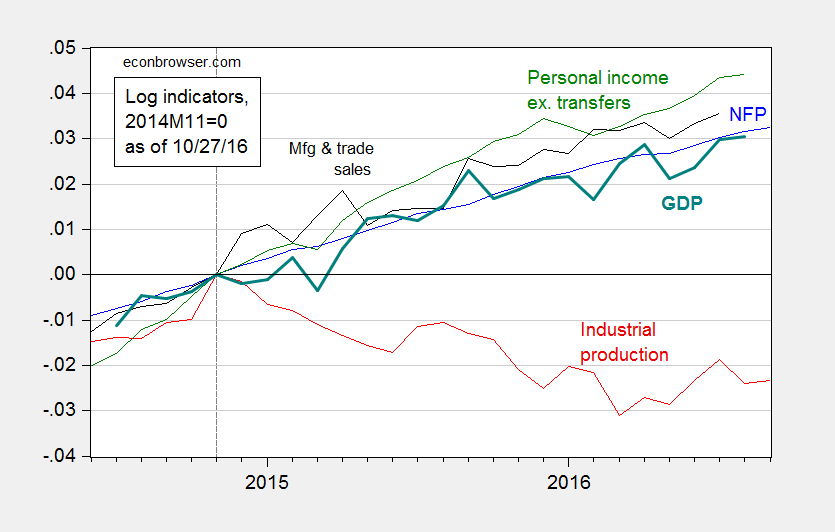
Figure 2: Log nonfarm payroll employment (blue), industrial production (red), personal income excluding transfers, in Ch.2009$ (green), manufacturing and trade sales, in Ch.2009$ (black), and monthly GDP, in Ch.2009$ (bold teal), all normalized to 2014M11=0. Source: BLS, Federal Reserve, BEA, and Macroeconomic Advisers (17 October release), and author’s calculations.
All these series continue to rise, save industrial production. As I’ve noted elsewhere, the downturn in manufacturing — ascribable in part due to the strengthening of the dollar and lagging rest-of-world growth — remains cause for concern. Still, this pattern of one indicator declining while others rise is not the same as what occurred in 2008 (see discussion here).
What about the future? Below, I reprise estimates from a term spread model, and one based on the Excess Bond Premium variable defined by Gilchrist and Zakrajšek (2012) (ungated 2010 wp version).
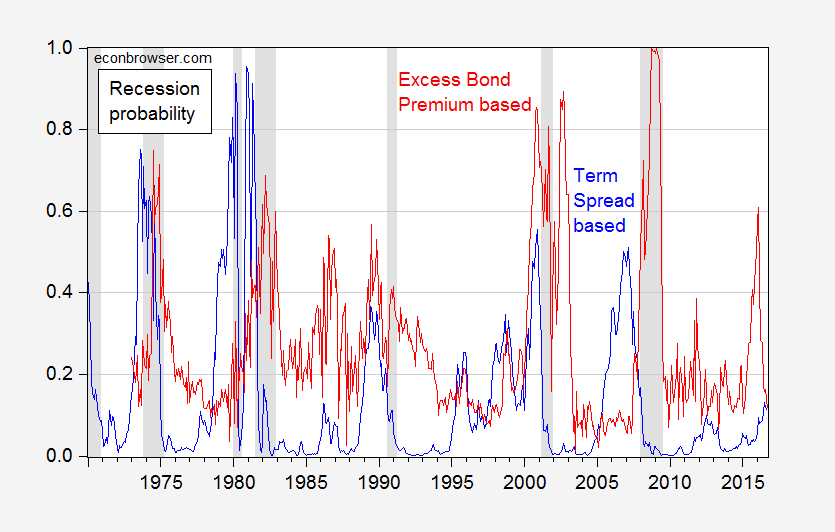
Figure 3: Probability of recession in next twelve months, from term spread (ten year-three month) model (blue), and EBP based (red). Source: Author’s calculations, and Favara, Gilchrist, Lewis, and Zakrajšek (2016).
Given the earlier jump in recession probability using the GZ indicator, it hardly seems time to rest easy. Still, the assessed probabilities as of September are not suggestive of recession in the next year.
More on the release: Furman/CEA, Calculated Risk, NYT, and WSJ RTE.
Professor Chinn,
Does “NFP” refer to non-farm payroll?
Yes. Sorry for omitting Figure 2 legend. Will fix.