I get to teach Public Affairs 854, “Macroeconomic Policy and International Financial Regulation” and Economics 435 “The Financial System” this fall. There’s a cosmic confluence this year, in terms of the subject:
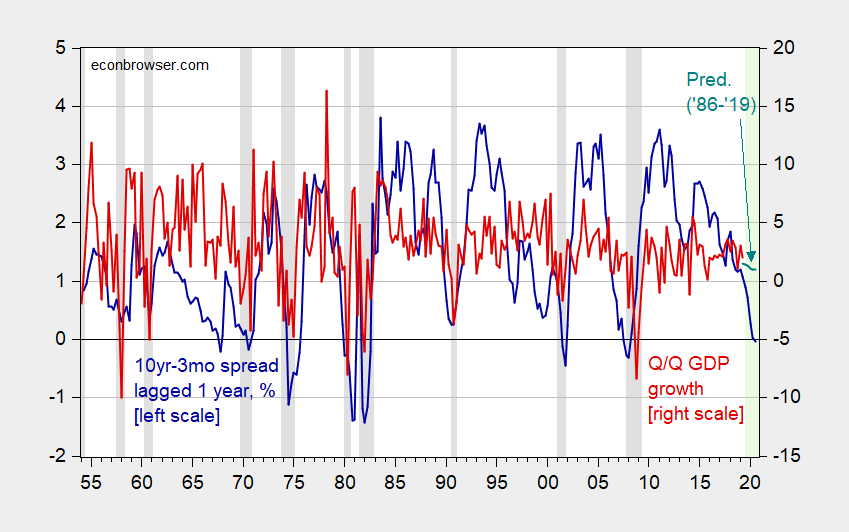
Figure 1: 10yr-3mo term spread in %, lagged one year (blue, left scale), and Q/Q growth rate SAAR, in % (red), and forecasted using spead, time trend over 1986-2019Q2 (green). 2019Q3 is July data. NBER recessions shaded gray. Forecast period shaded light green. Source: Federal Reserve via FRED, BEA 2019Q2 advance release, NBER and author’s calculations.
Figure 2: 10yr-3mo term spread in % (blue, left scale), and implied probability of recession, in % (red), probabilities estimated using probit on 10yr-3mo term spread estimated over 1986-2019M07. NBER recessions shaded gray. Forecast period shaded light green. Source: Federal Reserve via FRED, NBER and author’s calculations.
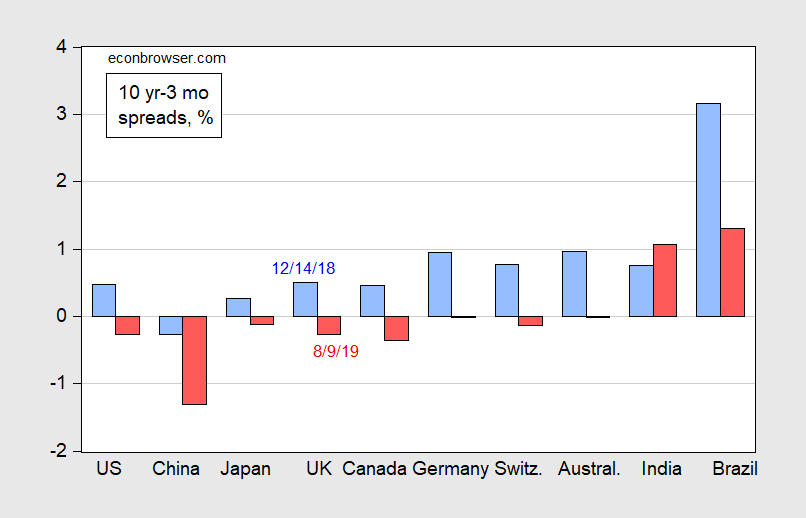
I’ve got a feeling that if not recession, then flagging growth, will be topics moved up in the syllabi in each course. In PA854, the international dimension will emphasized (and there, look at this scary picture):
Figure 3: 10yr-3mo spreads, in %, as of December 14, 2018 (light blue bar), and as of August 9, 2019 (red bar). Source: Reuters, Bloomberg, TradingEconomics, and author’s calculations.
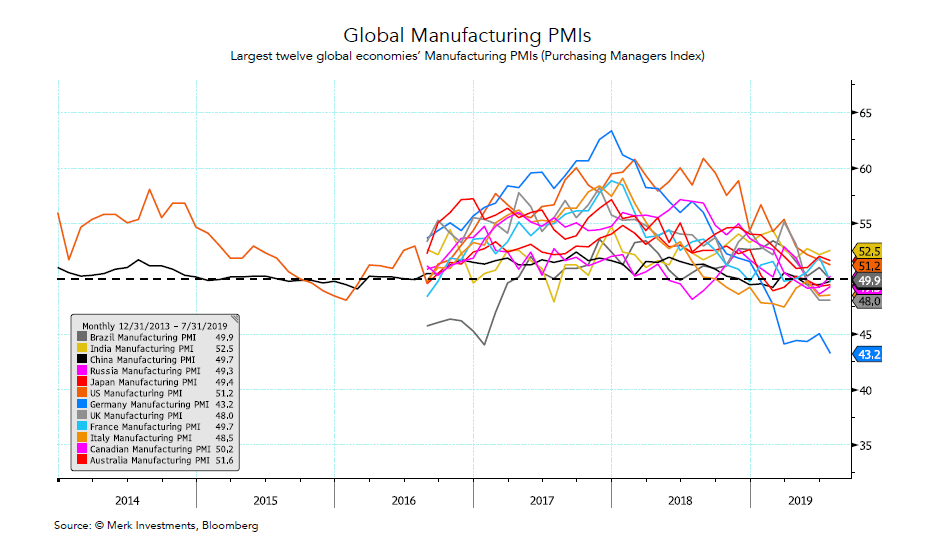
and this graph:
Source: Merk.
Spreads have gone negative in most other advanced economies, and PMI diffusion indices are even as I write moving toward negative. I’ll talk about the two country Keynesian model reinforcing the downdraft, in PA854.
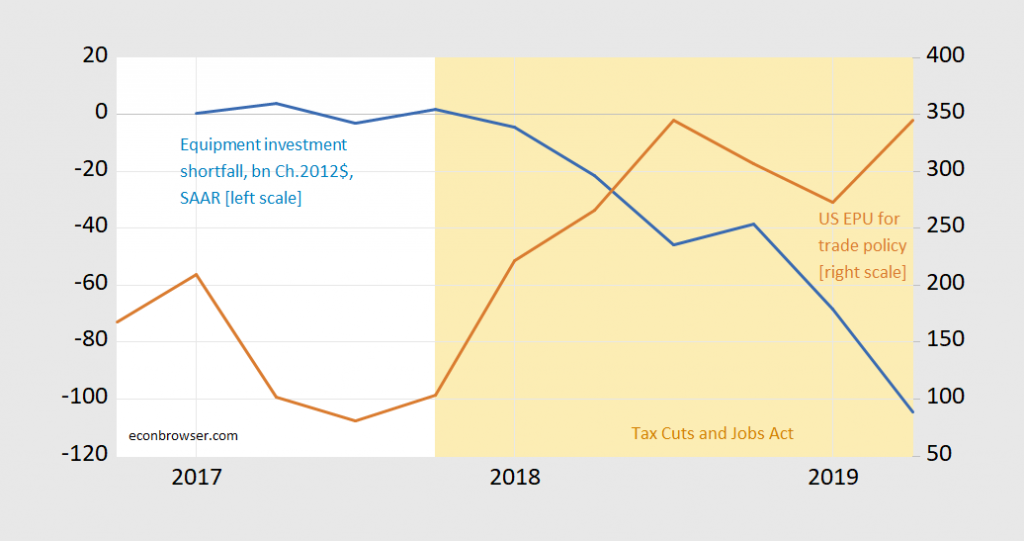
For Economics 435, well I’ll talk about expectations, uncertainty, and asset prices. One example will be to show how given a pecking order of finance, vast amounts of cash/retained earnings won’t be sufficient to offset sufficiently high levels of uncertainty.
Figure 4: Shortfall in equipment investment, in bn.Ch.2012$ SAAR (blue, left scale), trade policy uncertainty (brown, right scale). Light orange shading denotes TCJA in effect. Predicted investment using first difference equipment investment on current and lag of first difference GDP and first difference of real interest rate, 09Q2-2016Q. Source: BEA 2019Q2 advance release, policyuncertainty.com, and author’s calculations.
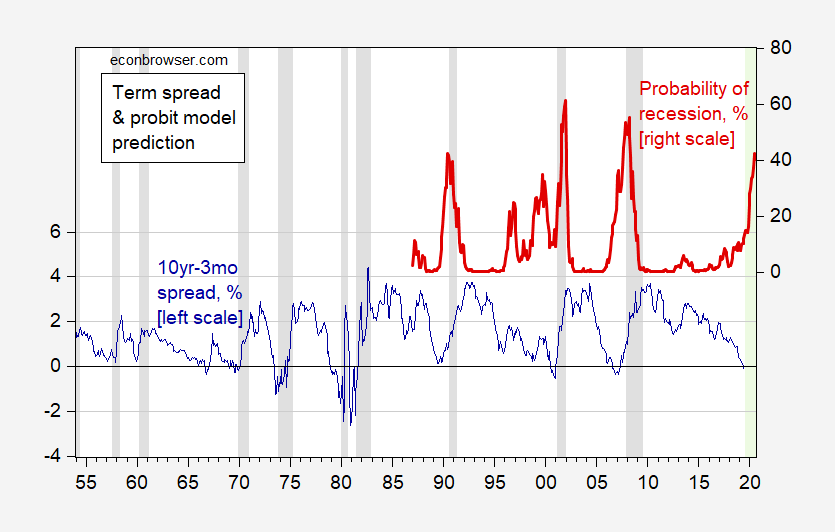
I’m aware that all 5 of these graphs carry some fearful visuals (or fear-inducing visuals??). I am also aware some sharp people can grasp things I can’t when looking at some graphs. But to MY eyes, the 2nd graph and the 5th (last) graph are the most frightening to look at.
Although those participating in Professor Chinn’s class have earned their place in their classroom seat where they have a level of intelligence and work ethic I don’t, I am a tad envious, and hope they know if they put the blood, sweat, and tears into Professor Chinn’s class, the dividends and rewards to be had later in life (in your “post-college” years) will be worth it. Wish any of you UW-Madison students reading this the blessings of God, “general happiness” in your studies or whatever the hell you personally choose to call it.
Professor Chinn brushes off some crumbs off his table here at the blog (sometimes he even brushes off 2-3 bread loaves), as does the scholarly and gentlemanly Professor Hamilton out Interstate 8 way, and there’s a group of us out here grateful for that.
Thank you for the succinct post.
Dear Professor
looking at chart number 1, i noticed that since 2008, the q/q gdp decoupled from the wigglings of the 10yr-3mo yield differential,
would this in fact be true, how does one trust the regression from 1950-2019 when 10 years of data from 2008 or 14% of all data
and more importantly the latest data appears to be changing?
i would like to better understand the hidden regression of “10yr-3mo yield difference” and its relationship to q/q gdp change vs
the end product which appears to be recession probability. how to i make the jump?
the follow up questions i would have
is there a regression you are doing? a probit regression?
is there an equation you could share audience?
and if no equation, then what is the r squared of your analysis, the confidence interval?
ed yu: For the GDP growth regression, I’m using 1986-2019 (“Great Moderation”) as indicated in green text. For the probit regression forecast (2nd graph), should’ve indicated more explicitly that using “Great Moderation” sample (since forecast probabilities in red only apply to 1987-2020).
The probit regression I’ve discussed in previous posts, but it is plain vanilla 10yr-3mo constant maturity regression with constant, monthly data– see here most recently.
The recommended textbook is Caves, Frankel and Jones, World Trade and Payments
Wow. My textbook edition is so old that it’s just Caves & Jones (sans Frankel). I guess it’s held up pretty well over the decades.
Haven’t you heard the news?? World trade under MAGA is now an “old fashioned” term. And when we look at world trade now we only do so in bilateral fashion. Tariffs, central planning, and social welfare payments to American farmers from trump’s USDA are now the cool and trendy things. Social welfare payments to American farmers who can’t pull themselves up by their bootstraps has now gone viral. American farmers now have to be fed and clothed by Uncle Sam and American farmers are too dumb to decide which crop to grow until “Big Government” tells them. Quit reading Bloomberg and “lefty” websites that promote free markets, the cool kids at university are now consuming the Navarro, Kudrow, and Mnuchin Comparative Economics textbook “How To F Yourself and Your Homeland 15 Different Ways” now being promoted on FOX Business News.
I’m not sure what the difference is between the model you are using and this one (updated Aug. 2) which shows about a 30% chance of a recession 12-months out (July 2020). https://www.newyorkfed.org/medialibrary/media/research/capital_markets/Prob_Rec.pdf
Regardless, whether it is 30% or 40%, there does appear to be increasing pessimism based on treasury spreads. This seems to be a sign that growth is continuing, but perhaps will be slowing.
What I don’t pretend to understand is with the 3-month and 10-year absolute rates so low, is there a point at which the historical relationship to signaling a recession gets muddied (becomes moot)?
https://fred.stlouisfed.org/series/DGS3MO & https://fred.stlouisfed.org/series/DGS10/ (use slider to see back more historical data.)
Bruce Hall: The August 2 post Figure 1 indicates “standard” at about 40%. 30% was for data through June I believe. Re: low interest rates: One could try to put in level of short rate a la Wright. Or one could adjust term spread by estimated term premium. That’s the 18% figure in the August 2 post.
I find the PMI most perplexing. In my estimation, the level of differentiation should be a bit more pronounced than it appears or at least some stratification. It appears the underlying economic factors are not being exposed yet or they are affecting all economies in a similar way.
Dear Folks,
This is another attempt to be fair to those who may not agree with me, but I think Bruce Hall is on to something. If there is going to be a recession, following the Jim Hamilton arguments, shouldn’t there usually be an oil shock first?
Julian
Julian Silk I’m not seeing where Bruce Hall said anything that would remind us to connect recessions to oil shocks. Still, you’re making a reasonable point. If you take the spliced WTI oil price data in FRED (file WTISPLC) and take the seasonal (one year) log difference in the monthly price and match it up to the FRED recession dates, you’ll find that you need at least a ~60% (in log differences) spike year-over-year to trigger a near immediate recession; however, there are at least three false positive signals in which the price spiked more than ~60% but a recession did not immediately follow. Caution: notice that taking the seasonal log differences captures the rate of change year-over-year, so a lower but still positive seasonal log differences following a spike only means that oil prices weren’t rising as fast. But there are a couple of anomalous cases. For example, the Reagan recession starting in Jul 1981 and began a few months after the year-over-year oil price actually started to fall. Similar story with the Bush 41 recession, which began in Jul 1990 even though oil prices started to fall in Apr 1990. But to your point there don’t appear to be clear cut cases in which relatively stable oil prices led to an immediate recession. And that’s a little counter-intuitive because you might expect a drop in oil prices to reflect a corresponding drop in global demand for all commodities.
Julian,
While oil price shocks generally trigger recessions, the latter do happen without them. The last was the one that followed the dot com bubble crash in 2000. Oil prices were low and not moving much before that one, although it was not a major recession, despite a slow recovery on the jobs front after it.
Dear 2slug baits,
You are right, I should have been more clear about that. I was referring to the James Hamilton article in The Journal of Political Economy in 1982 on the subject. Bruce Hall can speak for himself.
Of course, Barkley Rosser is right – it is possible to have a recession without an oil shock. But it has been the typical pattern that they have corresponded.
I hope people will allow me to make a little plug here. I would like to thank and applaud Barkley Rosser for his work on Comparative Economics. It was helpful to me when I was teaching the subject some time ago, and I am grateful.
J.