Two observations: (i) recessions do not necessarily coincide with negative output gaps (although they do seem to coincide with the beginning of periods of negative output gaps); and (ii) recoveries do not always coincide with positive output gaps. [This is an update of a 2008 post.]
This distinction can be illustrated by reference to the evolution of output in 2020, and forecasts.
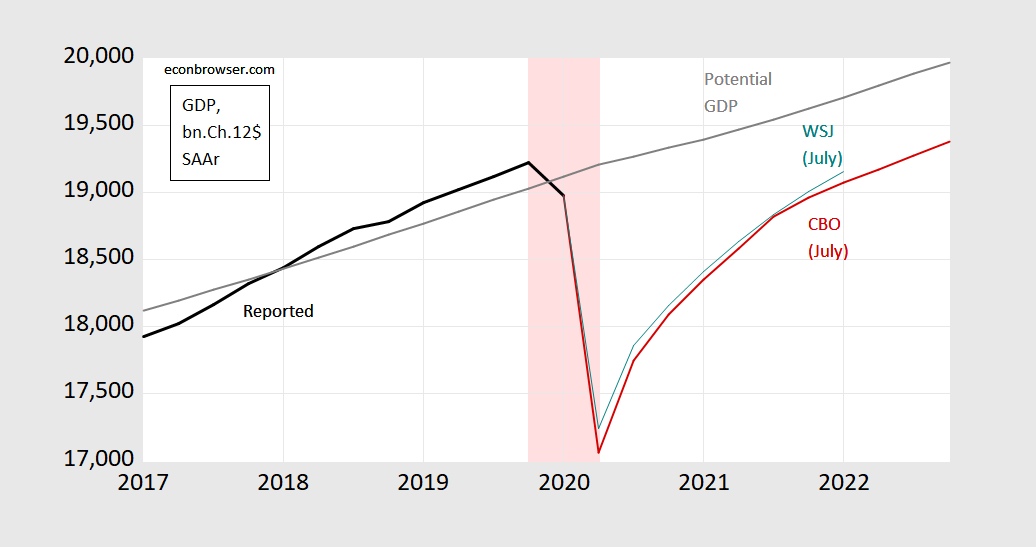
Figure 1: Real GDP (bn Ch.2012$, SAAR) (black line), potential GDP (gray line), CBO July projection (red line), and WSJ panel July survey mean (teal line). Hypothetical recession dates based upon NBER-defined peak date and 2020Q2 trough, shaded pink. Source: BEA, GDP 2020Q1 3rd release, and CBO, An Update of the Economic Outlook (July 2020), [data], NBER, and author’s calculations.
This difference is obvious when one thinks about it, given the NBER Business Cycle Dating Committee‘s definition of a recession (or “contraction”) as the following:
A recession is a significant decline in economic activity spread across the economy, lasting more than a few months, normally visible in real GDP, real income, employment, industrial production, and wholesale-retail sales. A recession begins just after the economy reaches a peak of activity and ends as the economy reaches its trough. Between trough and peak, the economy is in an expansion. Expansion is the normal state of the economy; most recessions are brief and they have been rare in recent decades.
That is a recession is the description of the first derivative of economic activity (broadly defined) taking on a negative value, while an output gap is a description of output relative to the output level consistent with the “normal” utilization of factors of production (also “full-employment”). For details of how CBO calculates potential GDP, see this document.
In the hypothetical recession dates shown above in pink, I use the NBER’s recently identified peak in 2019Q4 (for quarterly data, 2020M02 for monthly) as the start of the recession, and the lowest level of GDP in 2020Q2 as the “trough” (keeping in mind NBER does not use GDP as the sole indicator of economic activity; nor does the NBER use the oft-cited “2-consecutive quarter” rule of thumb). Then the recession is from 2019Q4 to 2020Q2, and expansion/recovery from 2020Q2 onward. In contrast, the negative output gap is obtains from 2020Q1 through the end of the sample in the graph. In fact, CBO projects that output will get within 1% of potential by 2027Q2. In other words, the technical (or NBER business cycle) definition of recovery doesn’t match the popular definition. [CEPR uses a slightly different methodology for the eurozone.]
There is of course a complication, one of particular relevance given the debate over a “W-shaped” recovery: if two local minima are sufficiently close together, does it make sense to count the short period between them as including an expansion? For instance, if Daniel Bachmann’s (Deloitte) July forecast (shown in the below figure) turns out to be accurate — and traces the path of the key indicators the NBER BCDC follows –, would that suggest two recessions or one?
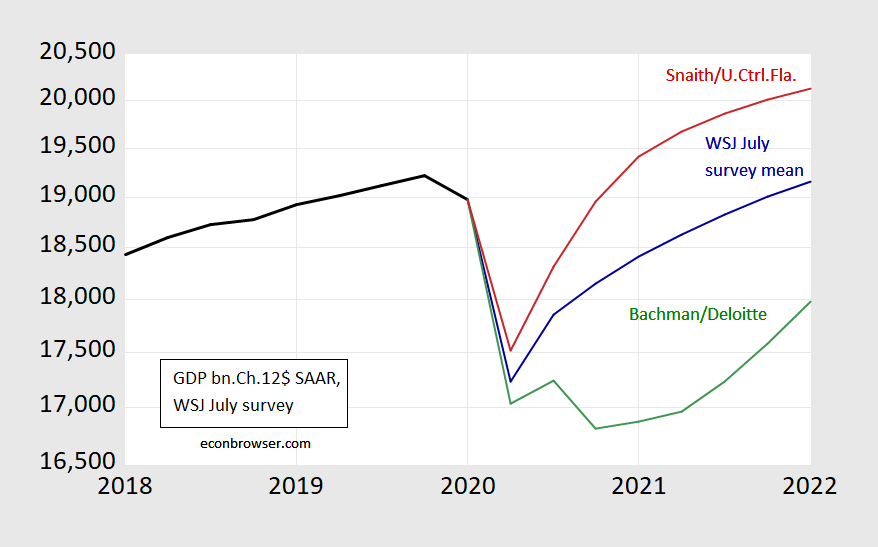
Figure 2: GDP in billions of Ch.2012$, SAAR, reported (black bold), WSJ July survey mean (blue), most “W” from Daniel Bachman at Deloitte (green), and one year most optimistic from Sean Snaith at University of Central Florida (red). Source: WSJ July survey, BEA, and author’s calculations.
Of course, the definition of a negative output gap — and determination of what magnitude — depends on an estimates of potential GDP. And this is variable that is not directly observable. CBO uses a production function approach, while time series methods are an alternative. Figure 3 depicts the July 2020 CBO estimate, and a time series method of extracting a trend. [Yet another approach would be to use a model — like a Phillips curve — to extract potential, a la Ball and Mankiw (2002); see this post].
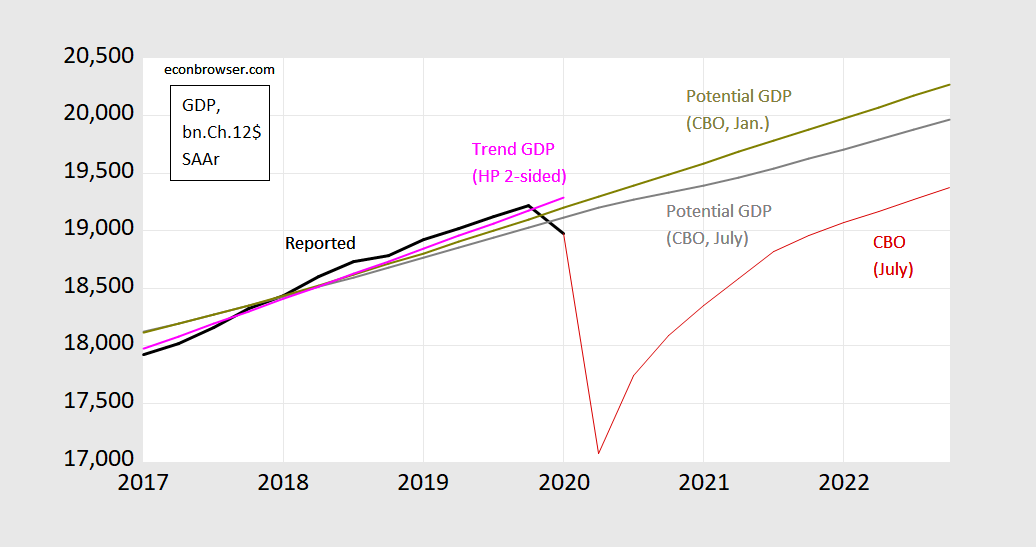
Figure 3: Real GDP (bn Ch.2012$, SAAR) (black line), potential GDP CBO estimate from July 2020 (gray line), from January 2020 (chartreuse line), HP filter (pink line), and CBO July 2020 projection (red line). Source: BEA, GDP 2020Q1 3rd release, and CBO, An Update of the Economic Outlook (July 2020), [data], Budget and Economic Outlook (January 2020), and author’s calculations.
There are many ways to estimate a trend — using linear deterministic time trends (with higher order terms), moving averages, and more complicated transformations.
The Hodrick-Prescott filter is a ubiquitous two-sided filter used in time series macroeconometrics and elsewhere. Essentially, the HP filter calculates a trend that minimizes the weighted sum of squared deviations from trend, and squared changes in the the growth rate of the trend. This weighting is controlled by a parameter which is usually set at 1600 for quarterly data. As a public service, I’ll note there are serious hazards associated with this filter, especially when trying to correlate various macro series that have been put through the same filter [1].
There is an additional problem (which is often ignored), namely that the HP filter is two-sided, so that running the filter up to the end point of data will tend to result in the trend being too close to the last data point (in our case, the output gap will be pulled to zero).
Alternative time series methods include band pass filters; the one most commonly used in the macroeconometric literature is the Baxter-King version. Band pass filters are called this because (in the frequency domain) they pass through any cyclical components within a particular frequency band, and elimates the others. In the time domain, this means fluctuations that are shorter or longer than a specific length are ignored. In the business cycle area, then, in order to use this filter, one would have to have a prior on how long a “typical” business cycle is. More on both the HP and BP filters can be found in Tim Cogley’s entry for the New Palgrave Dictionary of Economics [2]
In order to circumvent the two-sided filter aspect of the HP filter, one could do a standard fix, which is to use an ARIMA(1,1,1) on log GDP to dynamically forecast out 12 quarters, and then apply the HP filter to this “extended” series. I could have done a similar procedure for the BP filter. Alternatively, one could use the Christiano and Fitzgerald (2003) one-sided asymmetric version of the band pass filter to estimate the trend series.
I implement these methods in this post, but for here, I’ll just note the difference between time series and production function approaches. And even different vintages of the CBO estimates vary, as additional information comes in. One might hope that the estimates don’t change too much between projections — but one can see from Figure 3 that in the case of the 2020 Covid-19 episode, there is a noticeable change.
[I skip issues related to data revisions which have implications on the use of real time vs. final revised data — see Orphanides and van Norden (2002) [pdf].]
Despite these complications, the distinction between the rate of change in economic output, and where output levels will gravitate to (and at what pace) is a useful one to keep in mind. [Or as I tell my students, just because you’re out of the recession and into a recovery doesn’t mean you’re not in a world of pain…]
Update, 7/15 7:30pm:
David Andolfatto notes high frequency data suggests possibility of a W.

Kudlow alert! Kudlow is playing medical expert again telling us that this time we really have this virus under control:
https://www.cnbc.com/2020/06/22/larry-kudlow-says-a-second-wave-of-coronavirus-cases-isnt-coming.html
Reassured?
An oddity of this link is its reporting daily new infection rates of 30,000 on Friday and Saturday and claiming these are records. Not. Just had over 62,000 yesterday. Not sure what was going on with that bit of reporting. Hope they were not as off on other matters.
This, of course, does not provide any defense at all for that useless joke, Kudlow.
Navarro alert!
https://www.politico.com/news/2020/07/14/navarro-blasts-fauci-in-op-ed-362416
Peter Navarro, President Donald Trump‘s top trade adviser, blasted Dr. Anthony Fauci on Tuesday, claiming that the nation’s top infectious disease expert and the public face of the White House‘s coronavirus response has been consistently wrong while advising on how to contain the disease.In a brief oped published in USA Today, Navarro said: “Dr. Anthony Fauci has a good bedside manner with the public, but he has been wrong about everything I have interacted with him on.“
Navarro should go back to his usual China bashing. Of course what Navarro says about trade issues is also wrong in every respect.
Menzie,
Your update on recessions & output gaps is useful.
You mention 2 of the 3 approaches to estimating potential output: the production function approach and time series methods (filters) for estimating the trend in actual GDP. But what about the 3rd approach: a (slow-moving) estimate of the level of output such that inflation tends to accelerate when output is above that level, and decelerate below that level? A slow-moving estimate of the NAIRU can also be estimated as part of the system.
I suppose this method has been encumbered over the last decade by the relative unresponsiveness of inflation?
JF
Jeff Frankel: Thanks – good to know this post made sense. You are right about a third approach, which is to use the Phillips curve to infer potential; I’ve added a link to an earlier post, where I applied the Ball-Mankiw (2002) method. The relative paucity of use of this approach I attribute to the perceived break in the Phillips curve relationship.
Menzie (and Jeff),
Yes, the Phillips Curve models are looking especially bad right now, along with the closely related NAIRU models, which, frankly, have always had more problems than most would admit, given how widely they were accepted. But they are just completely in the trash bin of history right now.
I also appreciate your highlighting the problems with the Hodrick-Prescott filter that has been so widely used, usually with little thought or mention of any caveats. It has been a way overrated and over-believed technique.
The double-dip recessions of the early 1980s were 12 months apart. After the fact, there was talk that the first recession never really ended, that NBER pulled the trigger to quickly in declaring and end to the first recession. To me, a 12-month gap seems reason enough to declare two separate recessions, but what do I know? The Fed raised rates to combat inflation (which was a real thing back then) and ended up inducing the second of the dips.
Inflation at the time was partly the product of the 1979 oil embargo, so the two dips were, in a sense, both caused by the embargo. This time, if there is a second dip, the two dips will again have a common source.
“Recession” is a factor in economic narratives, so for people crafting narratives, timing is important. The double-dip in the 1980s sometimes complicates stories; “average hourly earnings growth slows after most recession – the recession of 1980 is a notable exception.” I don’t mind complicated economic stories, but complicated stories about particle physics make my head hurt, so I recognize the problem is real. I don’t think complications are necessarily reduced by deciding double-dips are a single recession. An extended period of growth within a recession would have to be explained.
Instead of a rule defining recessions, the U.S. uses a committee, whose members employ judgement. I wish them luck.
“The double-dip recessions of the early 1980s were 12 months apart. After the fact, there was talk that the first recession never really ended”
That may be the view of the Reaganites but in truth the economy grew by over 4% from 1980QIII to 1981QII. Volcker was backing off his initial tight monetary policies until he was appalled at the massive fiscal stimulus from Reagan’s tax cuts and defense spending increases. And then the FED really struck with tight money.
Of course those 1984 “Morning in America” political ads had people believing that Reagan saved us from the Carter disaster. No – the FED in 1983 reversed the Reagan disaster.
But expect Donald Trump this year try to claim he saved us from the supposed Obama recession. That’s what Republicans do – lie.
Macroduck —
It’s not just that there was a one-year gap between the two recessions. The equally important point is that real GDP (throughout 1981) had re-attained and surpassed the level of the previous peak. So it was natural for the NBER Business Cycle Dating Committee to declare the end of the 1980 recession; they would have done that even if they had known that the 1981-82 recession was coming.
JF
I remember the early 1980s well. They were not pleasant. I was a fresh college graduate looking for work and ended up moving to NYC. I figured somebody would hire me in the field I had studied eventually. Eventually was a couple years later, and in the mean time, I worked in a deli, drove a cab, did carpentry work, and all manner of other scrambling around to stay alive. At least there wasn’t a pandemic.
This recession has been a little bizarre to me. My usual rules of thumb and observations haven’t been especially accurate, relative. I didn’t think we were headed into a recession in Q4 last year, and I wasn’t convinced we had seen the peak in Q1 of this year until C-19 hit. Now, I expect performance along the Backman lines. It’s going to be another couple weeks before we have anything solid, and McBride is making me doubt my convictions a bit.
Yep. The sensible thing to do.
Noah Smith had an article on “alternative data” that was worth reading. Don’t ever say Uncle Moses didn’t try to “keep you in the know”.