Here’s the cumulative GDP decline relative to 2019Q4, nationwide:
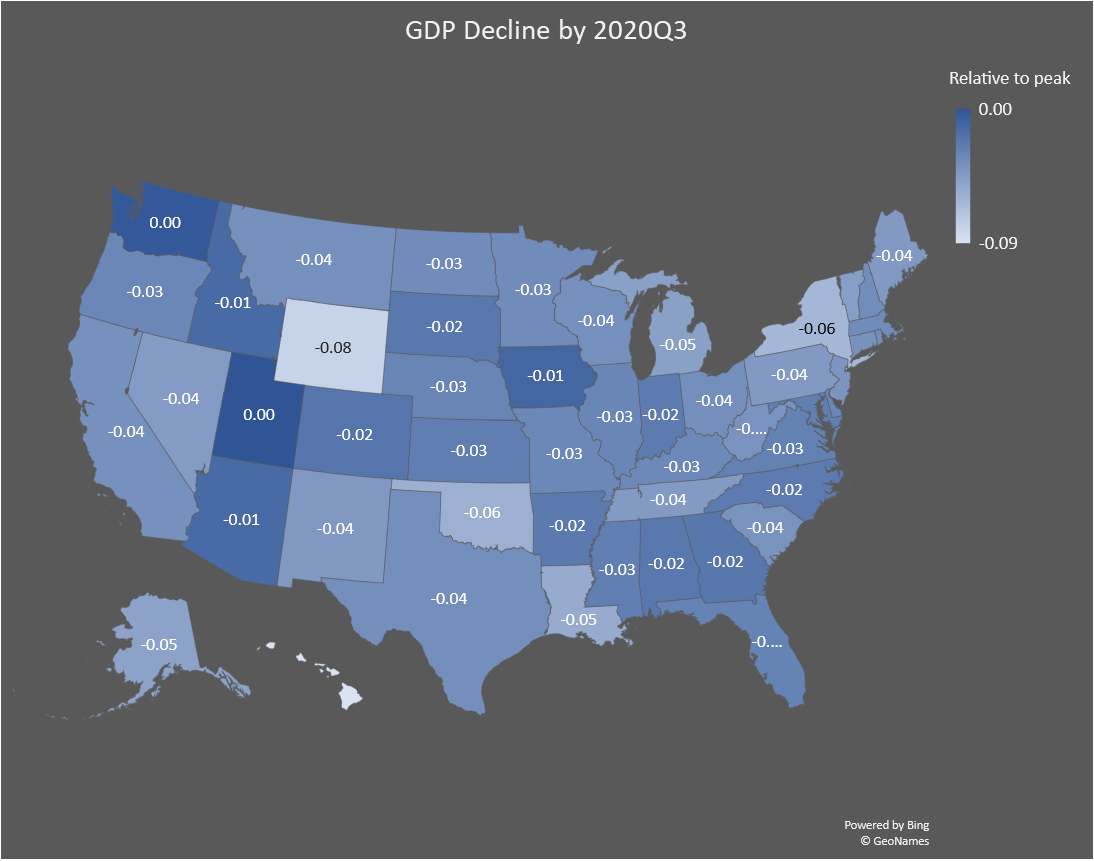
Figure 1: Decline in real GDP by state relative to 2019Q4 levels. Nationwide decline is 3.4% on this state level basis. Source: BEA and author’s calculations.
Wisconsin’s decline (discussed in this post) at 3.6% is slightly larger than the nationwide decline 3.4% (US GDP reported on a basis consistent with state level GDP).
Washington state, which has implemented fairly comprehensive public health measures during the pandemic, has done relatively well, with essentially zero net loss by 2020Q3; it’s second to Utah, which is the only state registering a gain (of 0.2%).
Public federal debt to GDP almost 100%
https://fred.stlouisfed.org/series/FYGFGDQ188S
Meaningless number.
It’s the ability to service debt that matters. Always has, always will be the case.
Did you not learn the rudiments of basic accounting?
Seriously, do try to think sensibly. Life is too short.
What a goofy statement. You believe interest rates will stay near zero forever!?
PeakTrader: One could argue that with the long term (centuries-long) decline in real interest rates, fiscal space is bigger than previously estimated.
That doesn’t mean real interest rates can’t rise substantially in the future and stay high for many years before continuing the centuries long downtrend.
PeakTrader: True – but seems a little less likely in an era of highly integrated international capital markets.
“That doesn’t mean real interest rates can’t rise substantially in the future and stay high for many years before continuing the centuries long downtrend.”
if you want to bring up this kind of fear mongering, you need to have some substantial evidence of when and how this is going to occur. otherwise, it is simply the equivalent of a rick santelli rant. and i am quite sure you cannot provide that evidence.
His statement was spot on. Now you may be too goofy to get it but hey!
Exactly. The government budget constraint is usually state in terms of the present value of future taxes – the present value of future government spending as compared to the current level of the debt. Of course understanding something like a discounted cash flow model is well beyond the mental abilities of Peak Stupidity.
Oh my – we are all going to die!!!
“Public federal debt to GDP almost 100%”
Yawn.
This was exhaustively litigated when Reinhart & Rogoff published their infamous ‘spreadsheet error’ paper (2009, I think), and again a year later when their book came out, and, because debt scolds & conservatives refuse to learn anything, yet again when Piketty’s book came out in 2013.
Scholarship advances whether or not we like the result. If you expect anyone here to take this seriously, other than your fellow Usual Suspects, you’ll be disappointed. You’re a minimum of 7 years behind the state of research. To me, that is what’s truly “goofy.”
You don’t live in a world of reality.
Every Accusation Is A Confession
And you do????
Hilarious, PT, given that you are the one out of touch with reality.
Indeed the burden of the debt is the interest payments on it, best measured as a percent of GDP. That peaked in recent decades at about 3.1% of GDP in 1990. It was as low as 1.3% of GDP in 2016, but has been rising since, now up to about 1.7%. So it is rising, but still barely above half of what it was 30 years ago.
Menzie,
I confess some confusion here, although this will probably lead to Moses going on and on in future posts about how I barely know how to put my pants on right (although given I teach by Zoom these days, that does not matter, lol). So, just to focus on Wisconsin, your map shows it having a -0.04 percent decline from 2019 Q4 to 2020 Q3. But then your text says that it had a -3.6 percent decline, which compares to a -3.4 percent decline nationwide, with no time period given. Also for none of these figures is it clarified if these are period-to-period or the SAAR numbers that Moses insists we must all be reporting on all the time every time. Given that the source is supposedly the BEA, which does tend to do SAAR, well, there seems to be a discrepancy between numbers on the map and ones in the text, in any case, whether they are period-to-period or SAAR or whatever.
Barkley Rosser: I had Excel round to two decimal places, so the entries would fit inside most of the states graphically. It’s a percentage decline (not logarithmic) 2020Q3 relative to 2019Q4 (so percentage is not SAAR).
Thanks, Menzie.
@ Barkley Junior
I never “insisted” people use SAAR. What I do insist though, is if certain morons in Harrisonburg VA criticize multiple respected sources for their “headline” GDP (which is SAAR) forecasts, that we stick to the same metric they are using, rather than jumping around to whatever metric, after we have been proven to be a jack-A$$ on the topic, and the numbers they quoted they were within roughly 4% (mine were much closer on the revised if you’ll remember, though, full disclosure, I never used any model) and yours were at minimum 30% off and arguably more when at one point you were arguing the GDP number could end up positive.
The reality is, for those who were paying attention, the first time you said that I immediately called you out on it, and commenter AS also at least gave you one chance to clarify. I also immediately announced I was going to drive it into the ground (another invite for you to correct your original statement, and other multiple statements where you cast aspersions on the respected sources’ numbers, including Jeffrey Frankel’s, which was another “out” I gave you to back out of your false contentions, which you let fly by, which you never corrected as “non-SAAR” until after the late July number came out). It was only AFTER you got the GDP number over 30% off that you started insisting you didn’t mean SAAR. Now being that you have labeled yourself a “mathematical economist” for roughly 40 years, you might know how the BEA quotes/calculates the headline GDP number. Again, which one makes you look worse, being over 30% wrong on the number, or not knowing how BEA calculates headline GDP, really ????? —-others can decide.
Others have already decided, Moses. Not a single person has stepped forward to support you in any of this while several have expressed annoyance with your entire approach to this, including your repeated insistence that everybody use SAAR numbers all the time, which you are now lying about having insisted upon since it has become clear that lots of numbers are not reported that way, e.g. by Menzie in this very post, and it is not always made clear in various reports just exactly which way the numbers are being reported. But that has not stopped you from indulging in the completely idiotic sorts of rants like this piece of manure you just indulged in and wasted everybody’s time with here.
@ Barkley Junior
Barkley never provides links, because links always prove Barkley wrong. That or somehow Barkley Junior’s dreadful senior years debilitate him from using his keyboard.
Only because Junior insists on it, will will go over his record once again:
All of these quotes are from Barkley Junior, except for the final one by commenter “AS”, who I would rank as probably one of the top 2 commenters (NO I do not include myself in the Top 2) of this blog. They include the links, so anyone can verify, or check the context.
“But now it is clear this projection is too conservative. If instead we assume that the increase in June is twice what was forecast, the moves it up by 1,000 to 18,000;. That remains a net negative for the second quarter, but now of only 300. That comes to a measly quarterly decline of -1.6%.
I do not know what that becomes annualized, but it is certainly not as negative [sic] as a -20% annualized rate.”
https://econbrowser.com/archives/2020/07/continued-recovery-in-june#comment-237996
“ ’Possibility’ it might be as high as -20% for second quarter? It now looks like consumption is highly likely to be positive for the second quarter kills any chance of overall GDP growth for the second quarter being -20% or lower. Heck, I would be very surprised if it is lower than-10%.”
https://econbrowser.com/archives/2020/06/gdp-nowcasts-june-26th#comment-237778
“As it is, yes, Frankel is indeed on the list of ‘authorities’ I am challenging regarding these projections of a massive GDP decline in second quarter.”
https://econbrowser.com/archives/2020/06/gdp-nowcasts-june-26th#comment-237929
“I do not know whether US GDP growth for second quarter will be positive or negative, but as of now it looks to be a close call,”
https://econbrowser.com/archives/2020/06/imf-world-economic-outlook-june-update-forecast#comment-237773
Barkley Rosser June 19th
“So it is highly likely that global GDP will exhibit positive GDP growth for the second quarter of 2020.”
https://econbrowser.com/archives/2020/06/guest-contribution-defining-recessions-when-negative-growth-is-too-common-or-too-rare#comment-237553
From commenter “AS” June 26th:
“Hi Moses,
As I recall, Barkley was the first and perhaps the only economist to say that we may have a positive 2020Q2 GDP, so I was trying to give credit to his comments which are far different from what the average of the forecasts by the various NowCasts.”
https://econbrowser.com/archives/2020/06/imf-world-economic-outlook-june-update-forecast#comment-237756
Folks….. two things. you might ask at this point. Question 1: Did Barkley Junior, after 3 decades working as a “mathematical economist” at a semi-respected but ill-named University “not know” that the number quoted by IHS, and the different Fed regions and quoted by Jeffrey Frankel, all of them un-camouflaged estimates of the BEA number itself, as apposed to, say, whatever number Larry Kudlow had made up, or some “Rt/R-naught” number the great epidemiologist Ron Vara had pulled out of his head…… did not know that BEA number was an SAAR tabulated number???
And Question 2: Why a PhD who can manage to use his keyboard for many things, can never provide links to anything??~~~(thereby giving him the excuse of not being able to link back to his own continually badly sourced data, while also misattributing quotes, and falsely quoting peoples’ argumentative stances, and having the excuse that “I can’t do links” when he repeatedly misstates the opposing person’s argument in a way that flatters his argument.
Nevermind Junior moving the football goal posts of Barkley’s own arguments….
I am sure everyone here is tired of these. I can sure you, I am tired of them as well. And on the day that Junior stops making asinine statements like those enumerated above, that is the same day on which these back-and-forths will HAPPILY end.
For the record, on July 12, I gave my best guestimate/prediction on BEA’s 2nd Quarter GDP. I guessed a negative (or decrease if you prefer) 28.88%. BEA’s 3rd revised number was negative (or decrease of) 31.4%.
https://econbrowser.com/archives/2020/07/an-improved-gdp-outlook-from-wall-street#comment-238481
https://www.bea.gov/news/2020/gross-domestic-product-third-estimate-corporate-profits-revised-and-gdp-industry-annual
As you can see from my prior comment in this same thread, the great “mathematical economist” Barkley Junior, was still saying the probabilities in his “mind” were quite good BEA’s 2nd Q number would end up positive. I was 2.52% off from the 3rd revised number for 2nd Q GDP, Barkley was “only” 30%+ off on the number. Barkley does want everyone here to know though, he still thinks the recovery looks like a “V”, so I guess you’ll all have to run to Vegas on that “V-shaped recovery” and make your bank as quick as you can on that one.
And, Moses Senior, for the umpteenth time, those quotes you like to reply repeatedly here were based on a single error of mine regarding measuring quarterly growth rates. My error, long ago recognized and admitted, was that the measure was from end of quarter to end of quarter. On that measure my comments were not wrong, but that is not the correct measure. I had the right numbers, just the wrong dates. Old news, Moses, Old news.
If you insist on dredging back into these discussions about second quarter, how about providing us with your still secret forecast on what the pattern would look like? You have been challenged on numerous occasions to put up or shut up on this, but you have done neither. What a joke.
As it is, while Not Trampis and Menzie argue that a pattern cannot be called a “V” unless the rate of growth is maintained without a flattening all the way back up to where it started declining, the fact remains that it looked like a V that flattens before it mekes it back, with you falling on your face ridiculing reports of the sharp V-like bounceback as I reported them coming out, such as your insistence that there was no way that consujmption grew at a record rate in May, with Menzie having to correct you on that. It remains the case that the last shape you actually touted here was that of a L, although you have since insisted that was not your forecast, which remains, uh, secret.
On, I know, you need to repeat all this old stuff as part of your effort at practicing EFT, Emotional Freedom Techniques, which allow you to indulge in unbridled hate and sadism, sort of like Trumpists insisting on running around without masks on in public places. This emotional freedom of yours allows you to spew out your hatred for various people ranging from me to various prominent older women.
I’m wondering Menzie, and this is a serious question in case you’re wondering, if Washington’s better GDP number has a relationship to its bordering Canada, its own population density and the population density of the states surrounding it?? This is NOT an argument against Washington’s “comprehensive measures”, just a query into how much you think that might have lowered the virus impact on economic output. Just at a glance and not checking my sources terribly carefully, it appears Montana, Idaho, and Oregon have very low population density.
You can find outliers, Oklahoma is an obvious example (and I think their OSDH number is even being undercounted, for the record), but your low population density states seem to do better.
Moses,
Pretty clearly not. If that were the case then one would expect other states bordering Canada to have done well also. As it is, we know that Washington is a center of some major high tech industries that have been doing well, so it is not at all surprising that is it doing well. You look pretty stupid not figuring this out.
And, what did all that federal debt get us over the past 10 years or so? – a weaker economy dependent on government?
https://www.advisorperspectives.com/dshort/updates/2020/12/22/q3-real-gdp-per-capita-32-7-versus-the-33-4-headline-real-gdp
Damned Republicans and their deficits
PT is even dumber than MH.
First of all – this cite is the kind of place the Proud Boys (or was that the Gay Guys) turn to for macroeconomic data. Secondly – no where did this link attribute the change in real GDP to fiscal policy. Come on Peaky – lay off the vodka.
So things which are coincident are necessarily causal, and the direction of causation is certain? Wow, learn something new every day.
hey peak loser, thanks for posting the link to this graph for the umpteenth time. but i would like to remind readers, when peak loser linked to this graph, it was to shout about the growing output gap under the obama administration. so lets revisit that for a minute. looks like that output gap certainly GREW LARGER under the trump administration. thanks for pointing out that failure peak loser.
Washington’s performance so far makes sense in light of historic data from the Spanish Flu pandemic. Not that we are doing as well as we would like.
It would be interesting to know if Washington wasn’t one of the original transmission points in America, would the numbers be better or worse??? Menzie might not believe this, but this is actually a question that enters my head in a mostly “naturally curious” way. i.e. I think it is an innately fascinating question. It’s really actually “random” from my view. Who is to say there aren’t “small localities” or “small quarters of” or “pockets” or “small enclaves” yada yada yada in say Germany where I might travel when visiting my ancestry, where they have bad hygienic habits (similar to Wuhan’s and far south China’s “wet markets” and I brought something I caught from unhygienic food or contagious aerosols back to America or to a small region in America where there was a large ethnic German population?? Nobody knows that wouldn’t/couldn’t happen—or might not in the future. Would we call it the “Germanic virus” if that happened?? I tend to doubt it.
Moses,
Not only is this not an “innately fascinating question,” it is barely coherent. You are really losing it.
So it isn’t the “Gina” virus, it’s the Seattle virus? It’s an interesting question, but I think it has to do more with how the governor reacted than anything else. We have plenty of deniers in the eastern portion of the state, but even an incomplete lockdown is better than none. I just happened to have been in eastern Washington for work yesterday, and found that the locals were actually pretty good about wearing masks. I didn’t see any of the stereotypical anti-mask behavior that rural areas have hurt themselves with. Maybe they got the fear of God put in them earlier when the virus exploded in rural Washington after it had been mostly contained in urban areas. I saw plenty of the usual aggressively right wing and downright nasty political signs that I’m used to seeing over there, but I didn’t see much overtly dumb behavior when it comes to dealing with the pandemic.
Maybe we are all in this together finally.
@ Willie
I’m comforted and heartened you also think it’s an interesting question Willie (no sarcasm there). It’s kind of you to say. The broad spectrum of both Washington’s citizens and government should be applauded for their rebound from the initial hit from the virus. How much better would the numbers have been had it not hit there prematurely vs. other states (through no fault of their own). It’s just a pondering that had entered my mind. I’ll close by saying I can only dream the state I reside in had reacted in as intelligent of a fashion as Washington’s state government did.
I don’t know that we would have done any better. The initial hit was high profile, but it wasn’t like what happened on the East Coast.
We do not have State GDP as there is the problem of exports and imports. how is this addressed overthere
Not Trampis: GDP is calculated using the production side, rather than expenditure side, approach. (So, we don’t have consumption, investment, imports at state level).
Thanks
Interestingly enough, Washington’s main manufacturer and exporter, Boeing, has been mostly shut down through their own mismanagement for most of the past year. I suspect that Washington’s performance would be somewhat better without that drag.
@ Willie
I was honestly wondering where “produce” (fruits and vegetables) fit in there. Obviously they must sell some raw product to restaurants (which would lower that part of demand), but theoretically wouldn’t the big jump in grocery shopping increase demand for WA produce (overall)?? I’m too lazy to google that one out at the moment, but my beer gut prognostications software is telling me “Yes goofball, yes Goofball, it would increase demand for WA produce”.
Durham wheat from Eastern Washington typically gets exported to Asia for noodles, if I’m not mistaken. Apples are a big export. I doubt that American supermarket demand would offset a big decline in agricultural exports. I also don’t believe the agricultural exports from this state have been hammered like other agricultural exports. Soy beans, for example. But, I haven’t done the research to verify any of that.
Willie: Washington state October year to date manufactured commodities are about one-half of 2019 levels. Non-manufactured commodities are slightly up (in value).
Finally got a copy of “The Plot Against America” on DVD. Very juiced for this. Watching something assumably intellectually stimulating AND slobbering a medium sized dot of saliva on my shirt while spacing out gazing at Winona Ryder. What more could a sick perverted male ask for??
See Menzie, I can make a blog comment without mentioning what the ancient Greeks referred to as ούρο. I told you I could.
https://fred.stlouisfed.org/graph/?g=qcDP
January 15, 2018
Gross Federal Debt as percent of Gross Domestic Product and Federal Interest Payments as percent of Gross Domestic Product, 1948-2019
https://fred.stlouisfed.org/graph/?g=sQCC
January 15, 2018
Gross Federal Debt as percent of Gross Domestic Product and Federal Interest Payments as percent of Gross Domestic Product, 1966-2020
December 28, 2020
Coronavirus
US
Cases ( 19,781,624)
Deaths ( 343,182)
India
Cases ( 10,224,797)
Deaths ( 148,190)
France
Cases ( 2,562,646)
Deaths ( 63,109)
UK
Cases ( 2,329,730)
Deaths ( 71,109)
Germany
Cases ( 1,670,194)
Deaths ( 31,176)
Mexico
Cases ( 1,383,434)
Deaths ( 122,426)
Canada
Cases ( 555,207)
Deaths ( 15,121)
China
Cases ( 86,976)
Deaths ( 4,634)
December 28, 2020
Coronavirus (Deaths per million)
UK ( 1,045)
US ( 1,034)
France ( 966)
Mexico ( 945)
Canada ( 396)
Germany ( 372)
India ( 107)
China ( 3)
Notice the ratios of deaths to coronavirus cases are 8.8%, 3.1% and 2.5% for Mexico, the United Kingdom and France respectively.
https://news.cgtn.com/news/2020-12-29/Chinese-mainland-reports-27-new-COVID-19-cases-WBM7jx1rG0/index.html
December 29, 2020
Chinese mainland reports 27 new COVID-19 cases
The Chinese mainland on Monday recorded 27 new COVID-19 cases, of which 15 were locally transmitted and 12 imported, the National Health Commission said on Tuesday.
Eight local cases were reported in northeastern Liaoning Province and the other 7 in Beijing.
Eight new asymptomatic COVID-19 cases were also recorded, while 262 asymptomatic patients remained under medical observation.
No COVID-19 deaths were registered on Monday. Meanwhile, 18 patients were discharged from hospital. The total number of confirmed COVID-19 cases in China reached 87,003, and the death toll stood at 4,634.
Chinese mainland new imported cases
https://news.cgtn.com/news/2020-12-29/Chinese-mainland-reports-27-new-COVID-19-cases-WBM7jx1rG0/img/4c5c6b4a121f4e27af1ed5986e093552/4c5c6b4a121f4e27af1ed5986e093552.jpeg
Chinese mainland new asymptomatic cases
https://news.cgtn.com/news/2020-12-29/Chinese-mainland-reports-27-new-COVID-19-cases-WBM7jx1rG0/img/dc68477b6c894cfeb698ac990762d23a/dc68477b6c894cfeb698ac990762d23a.jpeg
[ There has been no coronavirus death on the Chinese mainland since the beginning of May. Since the beginning of June there have been only limited community clusters of infections, each of which was an immediate focus of mass testing, contact tracing and quarantine, with each outbreak having been contained. Symptomatic and asymptomatic cases are all contact traced and quarantined.
Imported coronavirus cases are caught at entry points with required testing and immediate quarantine. Cold-chain imported food products are all checked and tracked through distribution. The flow of imported cases to China is low, but has been persistent.
There are now 348 active coronavirus cases in all on the Chinese mainland, 5 of which cases are classed as serious or critical. ]
Does your Beijing government run CGTN have any updates on putting a young female journalist in prison 4 years for discussing Covid-19?? Asking for a friend (or prior friends as the case may be)
https://www.theguardian.com/world/2020/dec/28/wuhan-citizen-journalist-jailed-for-four-years-in-chinas-christmas-crackdown
December 28, 2020
Coronavirus
Massachusetts
Cases ( 356,934)
Deaths ( 12,158)
Deaths per million ( 1,764)
————————————
December 28, 2020
Coronavirus
New York
Cases ( 972,951)
Deaths ( 37,518)
Deaths per million ( 1,929)
What will be sorely necessary is to examine state by state what at least appear to have been public health failings.
A fine explanation of farmers’ protests in India:
https://tribunemag.co.uk/2020/12/indias-popular-revolt
December 14, 2020
India’s Farmer Revolt
India’s government is trying to force through a corporate takeover of its agricultural sector – but their plans have met fierce resistance from the country’s farmers, who are refusing to hand over their livelihoods.
By Subin Dennis
Latin American countries have recorded 4 of the 13 highest and 6 of the 24 highest number of coronavirus cases among all countries. Brazil, Argentina, Colombia, Mexico, Peru and Chile. Mexico, with more than 1 million cases recorded, has the 4th highest number of cases among Latin American countries and the 13th highest number of cases among all countries. Mexico was the 4th among all countries to have recorded more than 100,000 coronavirus deaths.
December 28, 2020
Coronavirus (Deaths per million)
US ( 1,034) *
Brazil ( 898)
Argentina ( 944)
Colombia ( 828)
Mexico ( 945)
Peru ( 1,130)
Chile ( 857)
Ecuador ( 787)
Bolivia ( 774)
* Descending number of cases