While the GDP release dominated the news, we got new looks at economic activity and price pressures on Friday (and monthly GDP today).
First, economic activity according to some key indicators followed by the NBER:
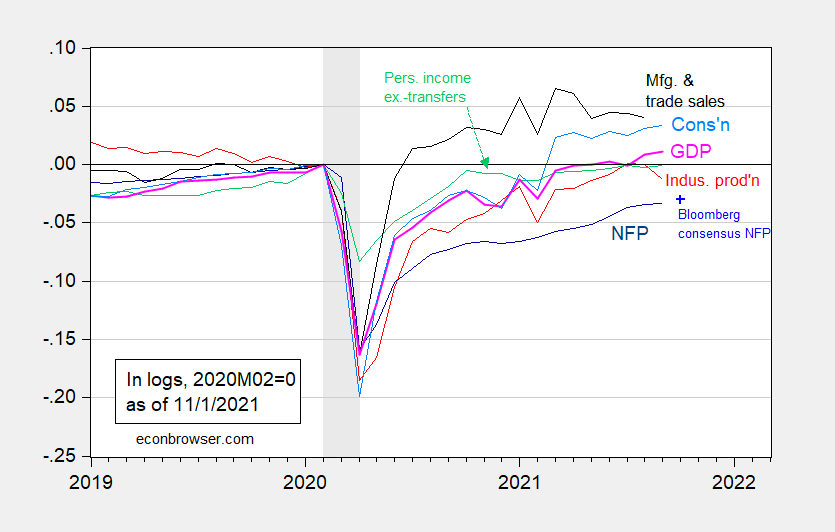
Figure 1: Nonfarm payroll employment from August release (dark blue), Bloomberg consensus as of 11/1 (blue +), industrial production (red), personal income excluding transfers in Ch.2012$ (green), manufacturing and trade sales in Ch.2012$ (black), consumption in Ch.2012$ (light blue), and monthly GDP in Ch.2012$ (pink), all log normalized to 2020M02=0. NBER defined recession dates shaded gray. Source: BLS, Federal Reserve, BEA, via FRED, IHS Markit (nee Macroeconomic Advisers) (11/1/2021 release), Bloomberg, NBER, and author’s calculations. [updated 11/1/2021]
Consumption remained at elevated levels, but personal income excluding transfers are only at pre-pandemic levels, in real terms. This is against a backdrop of other slowing indicators in September.
Second, inflation in September, including the personal consumption expenditure deflator numbers, which were released on Friday. These were in line with expectations.
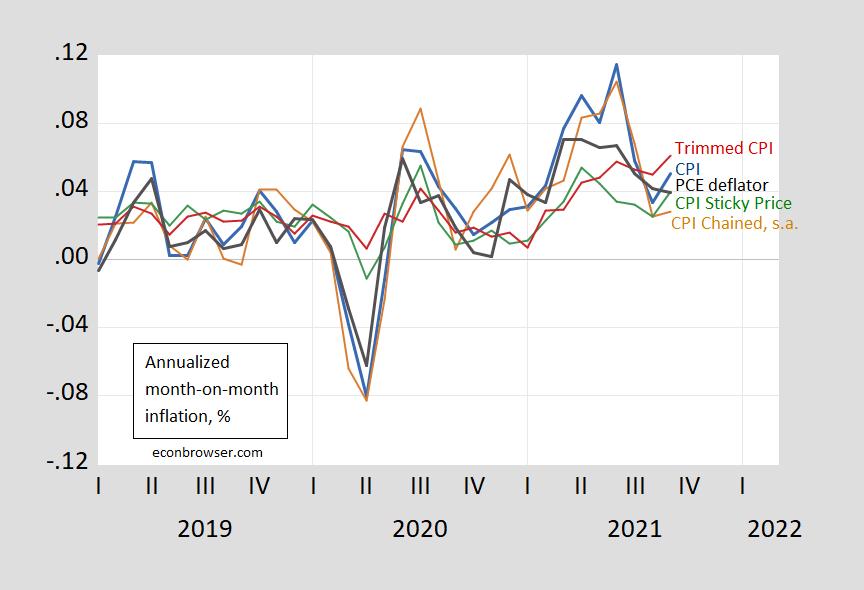
Figure 2: Month-on-month annualized inflation from CPI-all urban (blue), from personal consumption expenditure (PCE) deflator (black), chained CPI seasonally adjusted (brown), sticky price CPI (green), and 16% trimmed mean CPI (red). Chained CPI inflation seasonally adjusted by author. NBER defined recession dates shaded gray. Source: BLS, Atlanta Fed, Cleveland Fed, via FRED, NBER, and author’s calculations.
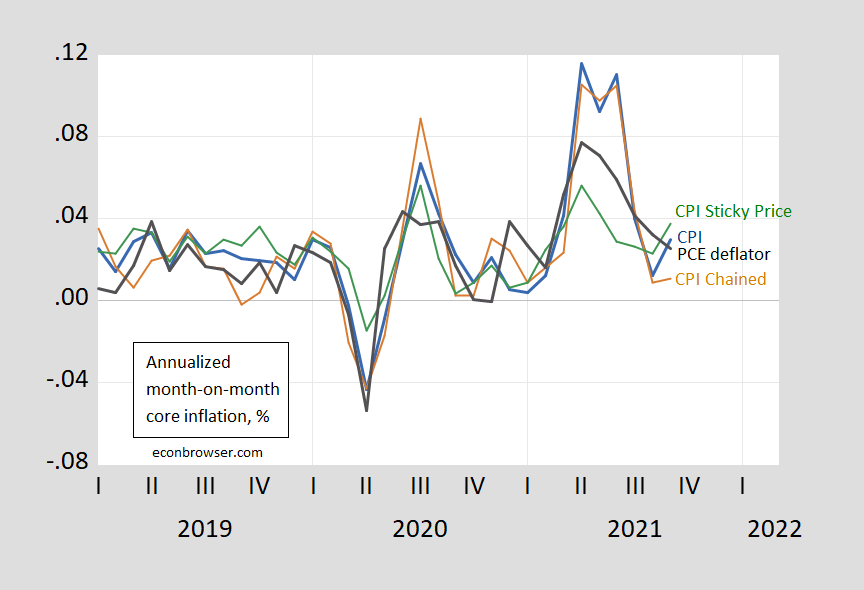
Figure 3: Month-on-month annualized inflation from CPI-all urban (blue), from personal consumption expenditure (PCE) deflator (black), chained CPI seasonally adjusted (brown), and sticky price CPI (green). Chained CPI inflation seasonally adjusted by author. NBER defined recession dates shaded gray. Source: BLS, Atlanta Fed, Cleveland Fed, via FRED, NBER, and author’s calculations.
What is interesting is that while the CPI based inflation indicators blipped upward, the PCE deflator inflation continued a downward trend.
CEA notes that year-on-year PCE inflation is being driven by developments in the indices from about 4-5 months ago.
‘Higher year-on-year inflation is largely being driven by price pressures from 4-12 months ago, as price increases in recent months have been declining.’
CEA’s tweet. Gee – we see some folks here talking about specific prices still soaring even as they have actually come down from their previous highs! Could someone please buy Princeton Steve a bagel?
there was a recent post on bitcoin, and some people concerned about illicit behavior and cryptos. interesting article from earlier in the year should dispel some of those concerns
https://www.forbes.com/sites/haileylennon/2021/01/19/the-false-narrative-of-bitcoins-role-in-illicit-activity/?sh=37a2aef23432
Bitcoin surge spurs City to recruit crypto natives
‘TradFi’ groups say they are investing in digital asset expertise for defensive reasons
JONATHAN GUTHRIE
This was an FT piece that came out today (sorry there is a firewall). Big banks are getting ready for crypto in some way shape or form. I like their comment that it may first appear in stocks and bonds as a blockchain tracked stock. wouldn’t it be nice to know how much each outstanding share sold for, when valuing a stock?
Some of your less well informed commenters have claimed that Biden is at fault for slow delivery times, ignoring the big increase in goods shipments in the U.S. relative to pretty much ever. So inflation is Biden’s fault and Trump deserves a Noble Prize.
I do wonder, though, how Biden managed to screw up delivery times in Europe:
https://blogs.imf.org/2021/10/25/longer-delivery-times-reflect-supply-chain-disruptions/
Dude must have serious hidden powers.
The same Usual Suspects are blaming the world’s logistics mess on California regulation. Yes – California rules the world!
“Supply chain disruptions have become a major challenge for the global economy since the start of the pandemic. Shutdowns of factories in China in early 2020, lockdowns in several countries across the world, labor shortages, robust demand for tradable goods, disruptions to logistics networks, and capacity constraints have resulted in big increases in freight costs and delivery times.”
Yep – all of this comes from Biden’s Communist plot!
none of those issues were evident on 20 jan 2021!
c’mon man in 1990 us army general pagonis moved an ‘iron mountain’ to kuwait and saudi to attack saddam, in <5 months!
there are a hundred things to streamline the bottlenecks, including firing the bureaucrats who can't increase the through put for re certifying cdl truckers to name one problem for the over the road transport system.
don't need dot…… thepentagon has a entire joint service command for transporting things …… land sea and air!
paddy kivlin: As I recall, the US relied substantially on prepositioned equipment/forces. See this document:
As I recall, this was one of the first big uses of roll-on, roll-off ships, which I’d first about in a seminar back in 1984.
“including firing the bureaucrats who can’t increase the through put for re certifying cdl truckers to name one problem for the over the road transport system.”
that’s overlooking the bigger problem. truckers are not paid enough to stay on the job. that is a private sector issue, not a government bureaucrat issue.
The Dude’s super power is not knowing on what planet he exists.
The real question is what planet are you from? What? You do not know either!
Did his predecessor have a firmer grasp of reality?
“I do wonder, though, how Biden managed to screw up delivery times in Europe. Dude must have serious hidden powers.”
We need to get you a seat by these clever Jewish joke writers for Stephen Colbert and Kimmel. You about killed me on that one.
Macroduck wins the internet on 11-1-’21
Would someone care to explain the important differences between PCE deflator and the others. I follow the blog, but am not a macro-economist. The wikipedia page for the deflator compares to the CPI, but aside from that PCE includes non-profit sectoral spending in addition to households, it isn’t really that clear to me. If the request is seen as obnoxious, then just ignore.
Not obnoxious. Good question.
The link below gives a pretty good summary of differences. Just to orient yourself before you go there, note that an index representing a bunch of components can be constructed in a number of ways. The construction of the index will determine how it changes as its components change. So here you go:
https://www.callan.com/blog-archive/cpi-vs-pce/#:~:text=In%20summary%2C%20the%20CPI%20represents,a%20broader%20range%20of%20buyers.
https://fred.stlouisfed.org/graph/?g=DP08
January 15, 2018
Consumer Price Index and Personal Consumption Expenditures Price Index
less food & energy, 1980-2021
(Percent change)
https://fred.stlouisfed.org/graph/?g=DaZv
January 15, 2018
Consumer Price Index and Personal Consumption Expenditures Price Index
less food & energy, 2007-2021
(Percent change)
https://fred.stlouisfed.org/graph/?g=FKhV
January 15, 2018
(Consumer Price Index and Personal Consumption Expenditures Price
Index) less food & energy, 2007-2021
(Percent change)
https://fred.stlouisfed.org/graph/?g=FKi6
January 15, 2018
(Consumer Price Index and Personal Consumption Expenditures Price
Index) less food & energy, 2017-2021
(Percent change)
@ Jacob
Questions seeking knowledge are NEVER “obnoxious”. And anyone who told you otherwise should be banished from your social orbit
My deceased father had his Master’s degree in education. He told me this in a more moderate fashion. I figure based on his major, he ought to know.
Thank you everyone for your considerate and helpful replies.
Jacob: Here is a slightly dated primer on Econbrowser. The big substantive change in the CPI is that the weights are adjusted every two years, making it closer in spirit to the Chained CPI.
US Federal Transfer Payments to Individuals significantly reduced: 1Q2020 $2.4T; 2Q2020 $4.8T; 3Q2020: $3.5T; 4Q2020 $2.8T; 1Q2021 $5.1T; 2Q2021 $3.4T; 3Q2021 $3.1T. [Source FRED]
Where you referring to this series?
https://fred.stlouisfed.org/series/B087RC1Q027SBEA
If so, you labeling sucks. Come on troll – learn to cite data properly. And providing a link is not that hard. But maybe you still do not know how.
From FRED: “Federal government current transfer payments: Government social benefits: to persons”
Of course, in economics “persons” is not “individuals.”
Oh gee – you finally got the label right. Now learn how to do links.
If you put error bars on those lines in your graphs, would the noise be so apparent that you could negate every interpretation presented and remain supported by the data?
do you have a better representation? or simply a party of no?
i took some flak half a year ago by suggesting you buy us savings bonds, which were paying 3.5% interest for a six month period. well today, the updated rate is 7.12% for the next six months. a couple can put $20k into savings bonds per year, and earn those rates risk free. a very good place to put your emergency stash of funds. beats the heck out of 0.1% from a savings or checking account. An extra thousand bucks risk free on cash that would have sat worthless in the bank.
https://www.treasurydirect.gov/news/pressroom/currentibondratespr.htm
as maui would say, your welcome!
What happened to our friend “A.S.”??? I miss him giving us his forecast numbers on different stuff. I assume our Polish friend (can’t remember the exact spelling of his name) is still out there reading as one of Menzie and Prof Hamilton’s “silent regulars”. How do we get more “AS’s” and less CoRevs here. The eternal mystery drags on.