Anonymous tells a story about an old engineer regaling people with aphorism like “you may know the significant digits but do you know the significance of the number”, in talking about what the average joe is experiencing. Here are some easily calculated numbers showing the distinction between mean and median average hourly earnings (note that median usual weekly earnings are the product of median earnings and median hours worked).
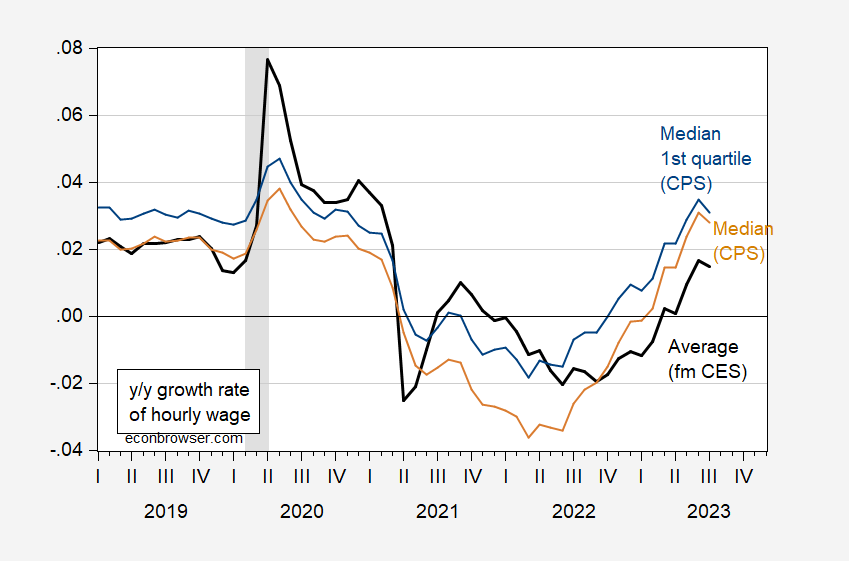
Figure 1: Year-on-year growth of average hourly earnings from CES adjusted by Chained CPI (bold black), median average hourly earnings calculated from CPS data (tan), median of lowest quartile calculated from CPS data (blue). NBER defined peak-to-trough recession dates shaded gray. Source: BLS, Atlanta Fed, NBER and author’s calculations.
Note that the median and median of lowest quartile wage growth have been rising faster than the average wage over the past few months.
Since Atlanta Fed’s wage tracker only reports growth rates, I can only show cumulative growth relative to a given date, for medians.
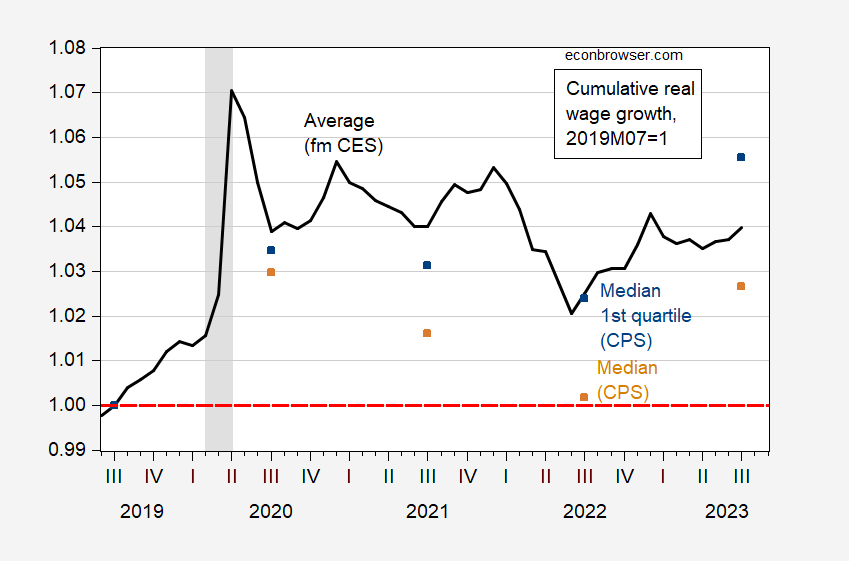
Figure 2: Cumulative growth of average hourly earnings from CES adjusted by Chained CPI (bold black), median average hourly earnings calculated from CPS data (tan), median of lowest quartile calculated from CPS data (blue), relative to 2019M07. NBER defined peak-to-trough recession dates shaded gray. Source: BLS, Atlanta Fed, NBER and author’s calculations.
The cumulative median wage growth has lagged the average. However, as I have noted previously, the lower income groups — such as those in leisure and accommodation services — have shown bigger gains. This is shown in the blue squares in Figure 2.
Previous posts on median wages, see here, here, here.
In sum: engineers are not the only ones who think about significance of the numbers.
Let’s put his comment in context. Bruce Hall starts off the conversation claiming we had 13% inflation (well if a year = 24 months maybe) and the real income had to fall by the rise in CPI (over two years). Of course one must factor in the increase in nominal incomes over the same period which was not zero for even an old engineer. Yea I noted nominal GDP rose by 16% not zero.
OK I confess – I did do the hard work by looking at real income for different income groups. But neither did this weird little reply.
Real Median Household Income in the United States was the series Anon linked to. Go back and click on the link. Annual data through 2021. But Brucie was talking about monthly data through April 2023.
Could someone ask this old engineer whether he recognized the dating issue here?
Growth of real factor income for the bottom 90% has declined since January 2020, according to realtimeinequality.org.
https://www.realtimeinequality.org/
Some might ignore that as insignificant, others could provide numbers from who knows where…
Notice how Johnny keeps trotting out new data series, none of which he actually k ows muchabout, in ordered to imply that something bad is going on? Why keep changing data series? And why the focus on particular starting and ending periods? Because Johnny isn’t interested un understanding the economy. And lord jnows he is unable to help anyone else understand.
No, Johnny is in the business of spreading discontent. He endlesslysneers at NATO countries for standing with Ukraine in the face of Russian aggression. He sneers endlessly at the division of income in the U.S., even as the division of income has improved.
Remember when Russia was spreading racist nastiness ahead of the 2016 election? Remember who was president ahead of the 2016 election? Well, Johnny doesn’t have the luxury of a black guy in the White House, but he’s playing the same basic game – he wants us to feel like something is wrong, to set U.S.citizens against U.S. citizens. He wants to divide us from each other.
Why? Because he works for Putin. These are the same tactics the Soviets used back in the last days of the U.S.S.R. – the old “moral equivanlence” trick. The moral equivalence trick rarely involved trying to make the Soviet Union look good – that ship had sailed. The only thing to do was claim that the U.S. was as bad as Russia. Sound familiar? That’s because Putin is an old cold warrior, determined to make Russia a home for oligarchs who bow down to the chief oligarch, Putin himself. So what does Johnny’s babble sound like? It sounds like he’ talking about the corruption of Russian society when he pretends to describe the U.S.
Surely, if you’re a casual reader of this blog, you are smart enough to see through Johnny’s tricks.
You might want to ask little Jonny boy a couple of key questions about his source:
(1) His source reports “factor income” by the following groups: Top 10%, Middle 40%, Bottom 50%, Total. They do not graph the bottom 90%. Now I guess one could subtract the top 10% from total but did little Jonny boy really do that? I doubt it.
(2) More importantly does little Jonny boy know what “factor income” even is. My understanding is that when BEA reports GDI – they also report it by “factor” as in things like wage compensation, profits, rents, etc. But his source is not doing that. Maybe Jonny boy can mansplain to us what he means by “factor income”. This should be a lot of fun!
pgl needs remedial 3rd grade math. Last time I checked, the bottom 50% and the middle 40% comprise 90% of the population. But pgl couldn’t figure that out!! Both groups showed negative real factor income growth since January 2020. Since the top 10% take home most capital market income, that means that the factor income of the bottom 90% is almost entirely comprised of labor income…and it has been declining.
But I’m sure pgl can come up with alternative figures from the seat of his pants to show that incomes for the bottom 90% have risen since January, 2020…
“Last time I checked, the bottom 50% and the middle 40% comprise 90% of the population.”
Jonny boy past preK arithmetic! YEA! Of course Jonny boy did not add the increase in “real factor income” – did he? And of course Jonny boy cannot define factor income?
Dude – your reply was incompetent as usual.
“Both groups showed negative real factor income growth since January 2020.”
You say this but you cannot bother to show this. Oh wait – you have no effing clue what factor income even means.
Which was my point dumbass.
“Both groups showed negative real factor income growth since January 2020. Since the top 10% take home most capital market income, that means that the factor income of the bottom 90% is almost entirely comprised of labor income…and it has been declining.”
Either Jonny boy is dumber than I thought or he is lying again. If one takes the labor income series and focused on the bottom 50% and the next 40%. both series are higher than they were pre-pandemic.
But Jonny boy keeps looking at another series which this dumbass cannot even define. Once again Jonny boy – do have a clue what they mean by “factor income”? Of course you don’t.
It is your link Jonny boy and oddly you have no effing clue what your own link is saying.
“Johnny keeps trotting out new data series” Ducky is asleep at the wheel again. I’ve referenced this data many times.
The question is, why does Ducky react so strongly to reports that show incomes of the bottom 90% are stagnant or declining? Does such data discomfit his Wall Street buddies?
Finish the sentence LIAR:
“Notice how Johnny keeps trotting out new data series, none of which he actually knows muchabout”
Once again – address my challenge as to WTF factor income even means. Oh wait you don’t know. Which proves Macroduck’s point.
“I’ve referenced this data many times.”
You have. Now you have never even remotely understood the data they are reporting. Which is par for the course for little Jonny boy.
“Growth of real factor income for the bottom 90% has declined”
Notice the weasel words Jonny boy used here. Jonny boy has no clue what factor income means. But never mind that. Jonny boy cannot say the bottom 90% has seen real income decline. No – it is rising for this group but just not as fast.
I played around with that chart isolating the increase in the real income for the top 10% and one interesting thing popped up. Over the last couple quarters, this chart suggests the real income for the top 10% has retreated.
Gee – Jonny did not notice that. Why? Because little Jonny boy is too stupid to understand his own link? Or does not really care what the data shows as long as this carnival barker can get up on his soap box?
Many moons ago, a paper assessing whether the “law of one price” holds across a large number of countries for some set of products concluded something like “signifcant price differences were observd, but the differences weren’t signifcant.” A play on words – the dfferences were statistically significant, but so small as to be trivial. I don’t remember the title of the paper, so I can’t offer a link.
Anyhow, the troll choir, when it bothers with data at all, often pretend the data tell a simple, politically useful story (why else would one tell a story?) when in fact, the data don’t support their story. They’re trolls. What did you expect?
digits……… number……??
Oh, I get it!!!! hahahahashahahaahhahahahahahahahahahahahahaah!!!!
This episode in esoteric humor hat isn’t esoteric brought to you by fake laugher Mike Moffitt.
Always be careful where you are standing when the Economics groupies swarm you Menzie:
https://madison.com/news/local/uw-madison-pier-collapse-wisconsin-union-terrace/article_0dfa262d-d58d-593a-be0f-00e4e89bb78f.html
We have a serious void in agriculture knowledge since the great crops storage expert CoRev and commodities arbitrage expert BlueStatesKopits have been quiet lately, I attempt to rectify this empty chasm of knowledge with the following link:
https://farmdocdaily.illinois.edu/2023/08/2024-crop-budgets.html
It is also said that corn and soybean prices are being hurt now by the heat and the drought. Hopefully CoRev’s throng of farmer friends at the local greasy spoon diner can fill us in. Maybe American farmers will receive another MAGA government social welfare miracle.
Anonymous is being mean – and I don’t mean median – I mean mean way above the mean meanness at this site.
@ Ivan
Do you know how hard I work to bring down this blog to the very lowest common denominator (see what I did there?), and you have the nerve to say Anonymous has beat our mean number of meanness?? Did you exclude me from the sample data??
I always exclude outliers if they are mean or bring the mean down. If result refuse to be mean at least they should be meaningful – if you know what I mean.
: )
Cue Lee Michaels’ “Do You Know What I Mean??”
It certainly does appear that ” “you may know the significant digits but do you know the significance of the number”, And the significance of the number is that average real wages have grown 1% since 4Q19 while median usual real weekly earning have grown less than that. And this pathetic wage growth has taken place in the midst of a very tight labor market. https://fredblog.stlouisfed.org/2018/02/are-wages-increasing-or-decreasing/
The question is why economists prefer to focus on the digits and obscure the significance, which is that the vast majority of Americans are not getting ahead, while GDP and incomes of the top 10% have grown nicely. And then, when the electorate rejects the incumbent, economists shake their heads as if mystified!
JohnH: You are comparing usual weekly median earnings against real average hourly earnings. You do understand weekly earnings is (wage/hr x hr/week) and the hourly earnings is (wage/hr)?
We have pointed this out to Jonny boy many times. And yet he continues to mix things up. Go figure!
https://fred.stlouisfed.org/series/AWHAETP
Average Weekly Hours of All Employees, Total Private
I provide the series because little Jonny boy does not know how to.
Funny! pgl doesn’t know that you can set FRED graphs to automatically update, which is why a 2018 blog post shows recent data…very useful data.
Once again – you ducked the substantive issues. Seriously dude – are you really THIS stupid?
Since weekly hours were virtually the same in February 2020 as in August 2023, how would using wages/hr x hr instead of wages/hr change the resulting growth rate? Either way the increase in real wages since before the pandemic has been about1%, a pathetic result whose significance is that it ought to raise concern in policy circles…particularly in a time of tight labor markets.
I see – you saw no variability in that series. Or did you not READ the blog post (as usual),
Jonny, Jonny, Jonny. That blog post has one real series compared to 3 nominal series. Something we have noted to you many times. And yet you still trot this out? Seriously dude – do you have any clue at all? Never mind – we know you don’t.
Now this is weird. It clearly is an update to his Feb. 2018 as he has recent data but he never changed the stated date of his blog post. And he did finally add a second graph with this text:
‘The second graph corrects for this bias. The three nominal series are now real, after being divided by the consumer price index so that general price increases aren’t reflected in the wage. Now all four series evolve along basically the same path. It’s clear that decreases can be frequent and sometimes long lasting. It’s also clear there’s a lot of variability, which means one should really wait for a good amount of data before reaching for any conclusions.’
Basically the same path has to be taken with a grain of salt. But Dr. Chinn’s point about weekly wages v. hourly wages still holds. We have pointed this out to Jonny boy many times but the little boy doesn’t get it.
I will ask you again. Why should real wages or earnings grow over that 4 year period. Please justify why that real growth should occur?
Wow! Baffling must love Trump!!! In a democracy with an expanding economy, why shouldn’t real wages rise? Baffling is advocating for all the income growth to go to the Top 0.1%, like Trump?
Wait – you are the one you darns the MAGA hat!
Johnh, you are incorrect in basically all of your assessments of me.
but I asked you a very clear question, and you did not provide a reasonable answer at all. why should real wages or earnings grow over that 4 year period. and why should we include the pandemic in that time period for an explanation? it is a severe outlier. and further, exactly what amount of real wage growth should have occurred, oh mighty one?
why should the real wages of a McDonalds front service clerk rise over four years?
let me ask you another question. is a person entitled to real wage growth just because they exist, and not because they contributed to the efficiency or growth? and please do not confuse real with nominal wage growth here, Johnny.
Yes when labor markets are tight the usual theory is that real wages rise. Of course the labor market was not tight under Cameron’s reign if fiscal austerity. A policy that you claimed raised UK real wages. Of course the FACTS (that you still deny 8 years later) showed UK real wages FELL A LOT up to the time that BoE’s quantity easing (a policy you complained about) got the economy back to full employment. Which is when real wages started their come back.
So big win for the usual theory sort of like Biden in 2020. But little Jonny boy is acting all Trumpian claiming he won that one. No loser – you lost. Theory won. Get over it.
Baffling–why shouldn’t real wages grow during a 4 year period when labor markets are unusually tight? Haven’t economists been telling since time immemorial that that’s exactly when real wages grow? So, baffling, if real wages don’t grow during such a period, when would you expect them to grow. Or, like Trump and his oligarch buddies, is it perfectly fine if they never grow?
“Haven’t economists been telling since time immemorial that that’s exactly when real wages grow?”
Cameron and his stupid fiscal austerity – which Jonny boy praised – lasted for more than 4 years. And yea real wages fell. But Jonny boy tries to tell us that real wages rose under Cameron.
Dude – own up to your lying about this as until you do, we’re going to remind everyone of your incredibly partisan garbage.
pgl moves the goalposts yet again. The UK’s ONS clearly documents that real wages started rising in early 2015, exactly when inflation fell to virtually zero and mainstream economists like Krugman were fearmongering about deflation and how bad it was going to get for workers. Besides rising real wages, the participation rate rose to a record high and unemployment to near record lows…so much for fearmongering about deflation!
Interesting that pgl won’t criticize Obamausterity (he even denied it!) but loves to criticize Cameron, even though the output gap at that time was much lower in the UK than in the US according to the OECD and the IMF. But pgl insisted on presenting his own figures, which came from who knows where…
The whole Cameron nonsense is just the usual pgl distraction from the point I was raising, which he never did address…
JohnH: We’ve had this exchange before. I responded before. I don’t know how you get your dates, but you omit the long decline in real wages associated with the Cameron austerity.
Yes when labor markets are tight the usual theory is that real wages rise. Of course the labor market was not tight under Cameron’s reign if fiscal austerity. A policy that you claimed raised UK real wages. Of course the FACTS (that you still deny 8 years later) showed UK real wages FELL A LOT up to the time that BoE’s quantity easing (a policy you complained about) got the economy back to full employment. Which is when real wages started their come back.
So big win for the usual theory sort of like Biden in 2020. But little Jonny boy is acting all Trumpian claiming he won that one. No loser – you lost. Theory won. Get over it.
Gee – our host has once again called out your dishonest rear end on the Cameron years. Dude – get over it. Everyone gets the picture and everyone knows you are totally divorced from the real world.
Now to Baffling’s point. There was a severe shock the world economy called the pandemic. I guess Jonny boy missed it. Massive unemployment that we FINALLY recovered from. Massive disruptions ot supply chains that are finally working themselves out. So a lot of noise – yes.
But maybe little Jonny boy has not noticed, real wages are rising of later as real profits have taken a tumble. But OK – remind of 2015 forgetting about the massive drop in UK real wages. We’ll keep laughing at you because you are that stupid.
Found this Reuters article via Yahoo. Interesting. Bet it made the Orange Abomination piss his pants.
https://www.yahoo.com/news/witness-trump-documents-case-reached-164044988.html
Enough of these dominoes fall and Orangey Mammal is going to have serious problems.
The deal was reached after U.S. Special Counsel Jack Smith’s office threatened to prosecute the witness, who is the head of information technology at Trump’s Mar-a-Lago Florida resort, for lying to a grand jury, the attorney, Stanley Woodward, said in the filing. Woodward currently represents Walt Nauta, one of the two Trump employees also charged in the documents case, in addition to having previously represented the IT head, who is not named in Wednesday’s filing.
When I heard ‘#4’ ratted out Trump, I suspected this was the IT guy. Of course the IT guy had to get a different attorney other than Nauta’s tainted lawyer. So WTF is Stanley Woodward doing in this filing? Hey Woodward – butt out unless you are smart enough to have Nauta flip too.