Reader JohnH is surprised that BEA reports distributional NIPA data, despite having commented on a blogpost on the subject two and a half years ago (he commented three times!)
In an unmentioned recent development, BEA is actually providing data on income distribution, something which should be of interest to macro students.
Given that some folks do not remember what they’ve read and commented on, I re-post, with link to updated information.
Using an incredibly powerful device called “the Google”, I have discovered new prototype data releases regarding the distributional aspects of real personal income. Here are some figures depicting income accruing to select household income percentiles, contributions to income growth therefrom, and Gini coefficients. These figures are from this Working Paper entitled “Measuring Inequality in the National Accounts” (updated 2020).
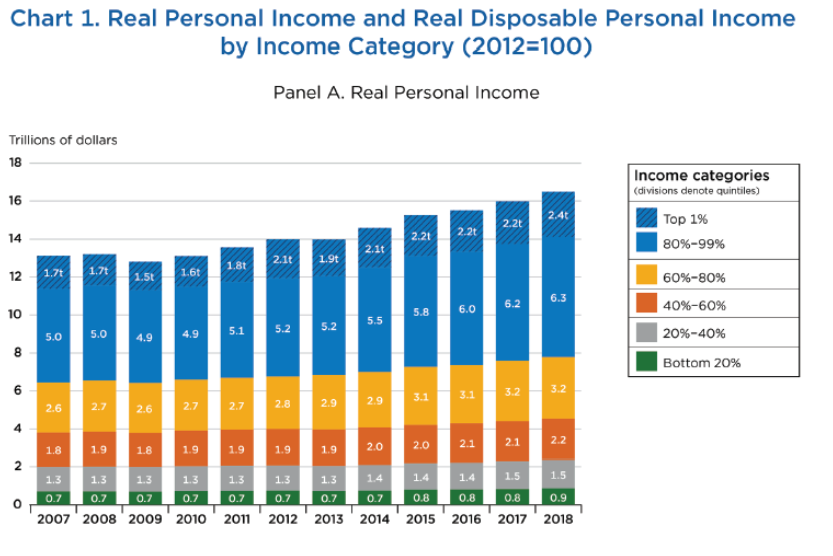
Source: Fixler, Gindelsky, Johnson, “Measuring Inequality in the National Accounts” (BEA, December 2020).
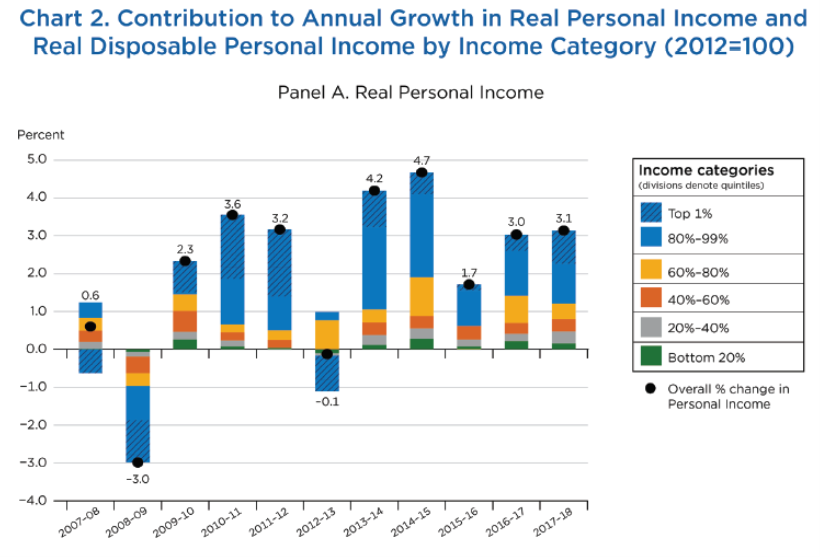
Source: Fixler, Gindelsky, Johnson, “Measuring Inequality in the National Accounts” (BEA, December 2020).
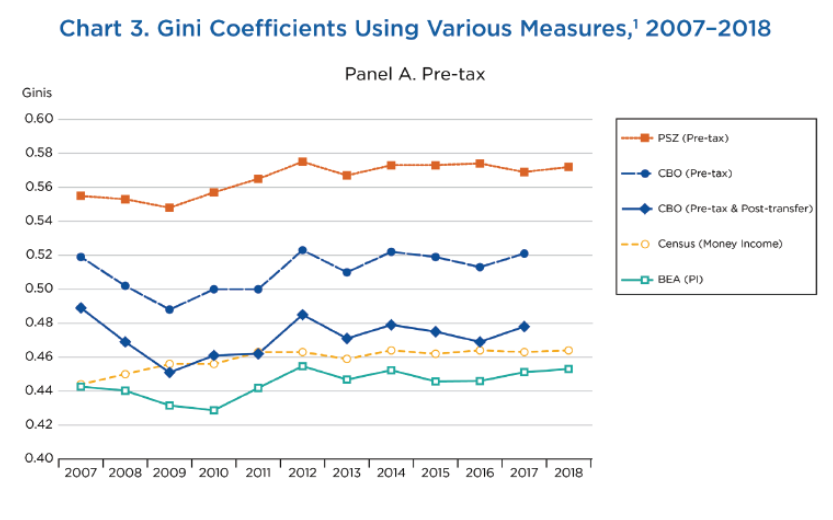
Source: Fixler, Gindelsky, Johnson, “Measuring Inequality in the National Accounts” (BEA, December 2020).
While some similar income statistics are available from the Census, these variables are constructed in a manner related to NIPA, so are useful for business cycle analysis. One could criticize the data as being at a relatively low frequency (annual). However, my guess is that reporting these series at higher frequency (e.g., quarterly) would entail such large amounts of interpolation and estimation that they would not be particularly useful.
The entire webpage on this subject is here. Technical details discussed here.
Update, 1/24/2024:
Since I wrote the above post 2.5 years ago, the BEA has updated its methodology, as described here.
One time series now available through 2022 is share of income.

Figure 1: Share of personal income for bottom half of income distribution (blue), of disposable personal income (tan). Source: BEA, and author’s calculations..
You are being too kind. Jonny disremembers because Macroduck and I have shown this lying troll that while real corporate profits did rise for a while they have of late been declining. Jonny boy has convenient memory problems whenever one of his stupid lies gets disproven.
Sorry, but since Johnny repeats the same old lies, disregarding evidence presented to him, I fell an impulse to repeat one of my pet wheezes –
It would be really great to discuss economics without some lying liar getting in the way. Moses and I just did a tiny bit of that regarding Germanys exports. No “Germany is BAD!!!” Or “What about those neo-Nazis?” Just exports. rjs posted out a sharp drop in the NY Fed factory index which gives reason to look hard at the Philly Fed, and also gave us a better look at Decmber retail sales data and Industrial Production data. James, Moses and I had a pretty objective chat about inflation and inflation perceptions. Baffling, Moses and I had a chat about FX reserves which didn’t include hyperbolic nonsense about China. pgl caught us up on U.S. greenhouse gas emissions in 2023.
But a great deal of effort, Menzie’s and in comments, is devoted to preventing the spread of lies from the troll choir. Menzie regularly offers a silver lining – he gets to point out to his students what bad thinking looks like – but good thinking could use some breathing room. Just a little. More than trolls currently allow.
You see it, I see it, pgl sees it. This “crazy” thing Menzie does to take something dark and turn it into a positive. Hell, He might have done it with me a couple times!!! (It’s our secret ok Macroduck??) Somebody says something dumb/ good intentioned but ignorant, and Menzie turns it into a “learning moment”. It’s like watching a 10 year old play poker for the first time. Menzie lets them play, and then shows everyone in the room how the poker cards were played. Then newbies to poker go “Ooooooooooohhh!!!!!”. This is what makes great teachers/profs. This is the magic ingredient. “Insults” can be an invitation to awakening.
The opening of their paper:
Simon Kuznets, in the 1930’s creation of gross domestic product (GDP), maintained that the aggregate totals were not sufficient to measure the economic well-being of society. In 1953, Selma Goldsmith, an economist at the Department of Commerce Office of Business Economics (OBE), produced an article in the Survey of Current Business that estimated the distribution of personal income (PI) from 1944 to 1950. The initial year, 1944, was the year that the Bretton Woods Agreement declared an international standard for measuring growth, gross national product (GNP). From 1950 to 1962, OBE and then its successor, BEA, regularly released distributional estimates in the Survey of Current Business (Fitzwilliams 1964). Estimates for 1971 followed Radner and Hinrichs (1974). The decomposition by income level is in the spirit of decompositions of BEA aggregate data by regions and by industry. This year, BEA has re-established these regular estimates with new prototype estimates (first released March 2020).
Discussed some 90 years ago by the legendary Simon Kuznets but JohnH thinks this is only a recent development? Oh well he generally is 2 centuries behind in economics so – progress!
China has cut rates:
https://www.cnbc.com/amp/2024/01/24/china-to-cut-banks-reserve-ratio-by-50-basis-points-from-feb-5.html
“Room for more cuts” was part of the announcement.
Pettis (among others) isn’t convinced rate cuts will.do much, because consumer demand is the big internal weakness, and households don’t borrow much. China has, however, recently announced a sizable spending program, which should help.
Bernanke’s message was “get ahead of it”. Probably a good idea for China.
How long will it take Johnny to declare that pointing out an economic policy change in one of the world’s two largest economies, on an economic blog, is schadenfreude? Can’t wait.
To be precise, a cut in the reserve requirement, not the overnight rate.
Mainland China loves to use the “RR” on banks to effect things. I can’t figure out why. Has Michael Pettis ever discussed this?? I suspect it’s like a mainland China “culture thing” where everything has to be stealth and not easily seen. Thoughts??? Why Chinese officials love the “RR” to adjust things??
In theory, manipulating the reserve ratio manipulates money supply. Banks create more credit on the same monetary base with lower required reserves. You can find recommendations that the Fed do the same thing.
Remember when the Fed targeted money supply rather than the funds rate? Imagine telling banks to run a lower or higher reserve ratio in an effort to reduce or increase money supply. It would be clunky as a method of fine tuning, I suspect.
I’m drunk now, But this answer is so good and thorough, Thanks Macroduck. It sounds so placating but I DO appreciate you so much Marcoduck. This world keeps turning and is so crazy. You’re a pinpoint of sanity for me Brother, And I love you for that.
Good news for free speech from the Supreme Court:
https://consortiumnews.com/2024/01/23/us-supreme-court-defends-free-speech-on-palestine/
Last one, I swear –
The Roosevelt Institute on corporate tax policy and human welfare:
https://rooseveltinstitute.org/2024/01/23/changing-narratives-corporate-tax-reports/#:~:text=A%20Mapping%20of%20the%20Full,of%20economic%20resources%2C%20regulate%20economic
Short version: “Tax ’em, Dano.”
Avi-Yonah writes a lot of interesting articles on how multinationals abuses the rules and transfer pricing to shift US taxable income to tax havens. Maybe Biden should hire him as a top advisor on corporate tax policy.
JohnH of late has been defending Art Laffer. He might enjoy Laffer’s latest with Kudlow the Klown on Faux Business. Their case for restoring Trump to the White House?
https://www.foxbusiness.com/video/6345503704112
US will see a strong bull market under Trump: Art Laffer
‘Kudlow’ panelists Art Laffer and Dan Clifton break down the impact of stocks in a second presidency from former President Trump.
Not real wages, not workers, the stock market. This is who JohnH cheers for ?!
But, but…Historically, stocks have done better under Democrats:
https://retirementresearcher.com/are-republicans-or-democrats-better-for-the-stock-market/#:~:text=The%20market%20has%20done%20significantly,than%20with%20Republican%20divided%20government.
The best performance by far is with a Democratic President and split government.
But who cares? It’s the economy, especially employment, that has most to do with human welfare. When it comes to the unemployment rate, employment and GDP, performance is best under Democratic presidents:
https://en.m.wikipedia.org/wiki/U.S._economic_performance_by_presidential_party#:~:text=CNN%20reported%20in%20September%202020,difference%20of%201.6%20percentage%20points.
Someone always finds fault with whatever metric is chosen, so how about we use a bunch of them, separated by states most often under Democratic vs Republican control? The answer is…Democratic leadership does best:
https://gppreview.com/2020/02/21/growing-divide-red-states-vs-blue-states/
Education, median income, GDP per capita, health insurance, poverty, unemployment- Democratic political leadership is associated with better results.
Which is probably why Johnny only ever criticized Democrats.
Dale Coberly showd us all of this, years ago.
OK, this kinda dumb guy will bite, “Dale Coberly???”
Damn man, You’re making me regret I ever thought myself “smart”
Coberly was an Angry Bear contributor who wrote a book right in front of us. He’d post notes from his research at AB on the way to writing a draft of the book.
The subject was the evaluation of the effects of various economic policies. My little list of things that go better under Democratic leadership is a small taste of what Coberly wrote. Right-wingers howled in comments, using all the rhetorical tricks that out troll choir uses, but Coberly had the facts.
He’s a specialist in Social Security policy, by the way. Worth finding things he has written.
God bless you Sir. I will look him up and read.
On my last beer can now brother, About 30 minutes later feeling incredibly sad. that “down down” moment, when the drink runs out. boo hoo boo hoo look up the last half of Kristofferson’s Trinidad concert. It’s a nice one. Then there’s Junior Brown’s Texas saloon concert. blablabla buhduh buduh buhduh…….
Macroduck, you made me feel so slow, I can’t even watch Burt Wolf, anymore, it’s now illegal for me to watch Burt Wolf. : )
https://www.youtube.com/watch?v=Vw3Q7KEB884&t=296s
See what you did now?? Shlomo?? Oh my goodness…….
Just became a Wolf subscriber. Thanks.
Seriously? Regurgitating a post from three years ago? The issue is not whether I recall BEA data or not. The issue in question is whether study of real wages and inequality is included in the macroeconomics course. The BEA data is a major statistical change that has occurred since the 2001 syllabus…but still there is no sign that it is being integrated into any of the macro courses. Nor is there any sign that data from other sources such as the Federal Reserve, US Census, Social Security and Real Time Inequality are considered at all relevant to macroeconomics.
I perused the on-line course catalog’s descriptions of economics courses at UW, and I could find no mention of real wages or inequality.
Since Piketty, how can any serious macroeconomics curriculum ignore inequality? (Trump and his billionaire buddies must be overjoyed by programs that bury discussion of inequality and its nefarious impact on economic growth and public policy.)
You once again prove you are an utter weasel. Let’s take just two sentences:
‘The issue is not whether I recall BEA data or not.’
You were the one who falsely claimed that this data was only recent. You lied and now you are trying to argue your lying is not relevant? Just wow.
‘The issue in question is whether study of real wages and inequality is included in the macroeconomics course.’
Hey lazy little lizard. We told you to read Chapter 7 of the macroeconomic text which covers Labor Economics. I guess you have not which means you need to shut the eff up until you do read it.
“I perused the on-line course catalog’s descriptions of economics courses at UW”
Wow – you can infer what is covered in a course by reading a single paragragh? No need to read the textbook or attend the classes? No wonder you are the most uninformed dumba$$ God ever created!
I have a question for Dr. Chinn regarding John Kennan who I understand teaches labor economics at Wisconsin. I do not know him but I have checked his impressive CV. Now JohnH is trying to tell us that no one at your economists program talks about real wages. I find this hard to believe so please tell us whether John Kennan’s classes ignores these issues. Thanks in advance.
“Nor is there any sign that data from other sources such as the Federal Reserve, US Census, Social Security and Real Time Inequality are considered at all relevant to macroeconomics.”
Of all of your insulting and incredibly STOOOOPID comments – this one takes the cake. Dr. Chinn’s students are invited to go to this blog which reminds people about these and many other useful economic data sources. Maybe you are too lazy and too dumb to check out this and other relevant data sources, but the University of Wisconsin attracts a lot of bright kids.
Look dude – you are not making a total fool out of yourself (what’s new) but this has gone beyond rude and insulting. Two words: SHUT UP!
If a tree falls in the forest, and no one hears it, did it really fall?
If data on inequality is readily available, and mainstream economists don’t talk about it, does inequality really exist? [Wealthy donors to endowed chairs most likely prefer to keep it quiet !]
JohnH: I don’t have an endowed chair. I talk about inequality. On this blog. In my classes.
If a tree falls on Jonny boy’s head it would not matter as Jonny boy has no brains
Johnny, you do not have the qualifications to change somebody else’s course agenda. until you have the qualifications to teach a course or write a book, then your comments are simply noise that others may or may not take into consideration. they are under no obligation to listen and take action based on your wants. same goes for another on this site who behaves in a similar way, econned. neither of you have the qualifications to be an influencer. you may have the qualifications to be a noise maker.
“Since Piketty, how can any serious macroeconomics curriculum ignore inequality?”
After all – Capital in the Twenty-First Century came out just over a decade ago! Oh wait Simon Kuznets was talking about income inequality almost a century ago. I was in graduate school when Jimmy Carter was President and inequality was a highly discussed issue in my classes.
Which is to note the obvious – JohnH is a MORON. But that has been generally known for well over a decade.
LUV IT: “Simon Kuznets was talking about income inequality almost a century ago.”
But it’s ignored in macroeconomics courses today! Go figure!
How many times are you going to repeat that stupid lie. Dude no one gives a rat’s a$$ about your discredited BS A
You can’t fault JohnH for lacking diversity in his posts. In addition to bemoaning futile, costly wasteful wars—with the exception of approval the Russian invasion of Ukraine and the slaughter of civilians there—John has most often seen fit to inform nonbelievers of the sins, shortcomings, and omissions of
1. Mainstream economists
2. Mainstream economists
3. Mainstream economists
4. Mainstream economists
5. Mainstream economists
Not an economist himself and lacking an understanding of econometrics—as well as basic math—he has no problem quoting other clearly uneducated non economists or in demanding others provide the data he cannot..
JohnH is his name. Unfortunately, as we see daily , economics is not his game.
Not whether JohnH can recall what he said previously? More proof a liar does require a good memory.
https://www.bea.gov/news/2024/gross-domestic-product-fourth-quarter-and-year-2023-advance-estimate
Gross Domestic Product, Fourth Quarter and Year 2023 (Advance Estimate)
Real gross domestic product (GDP) increased at an annual rate of 3.3 percent in the fourth quarter of 2023 (table 1), according to the “advance” estimate released by the Bureau of Economic Analysis. In the third quarter, real GDP increased 4.9 percent. The GDP estimate released today is based on source data that are incomplete or subject to further revision by the source agency (refer to “Source Data for the Advance Estimate” on page 3). The “second” estimate for the fourth quarter, based on more complete data, will be released on February 28, 2024.
The increase in real GDP reflected increases in consumer spending, exports, state and local government spending, nonresidential fixed investment, federal government spending, private inventory investment, and residential fixed investment (table 2). Imports, which are a subtraction in the calculation of GDP, increased.
The increase in consumer spending reflected increases in both services and goods. Within services, the leading contributors were food services and accommodations as well as health care. Within goods, the leading contributors to the increase were other nondurable goods (led by pharmaceutical products) and recreational goods and vehicles (led by computer software). Within exports, both goods (led by petroleum) and services (led by financial services) increased. The increase in state and local government spending primarily reflected increases in compensation of state and local government employees and investment in structures. The increase in nonresidential fixed investment reflected increases in intellectual property products, structures, and equipment. Within federal government spending, the increase was led by nondefense spending. The increase in inventory investment was led by wholesale trade industries. Within residential fixed investment, the increase reflected an increase in new residential structures that was partly offset by a decrease in brokers’ commissions. Within imports, the increase primarily reflected an increase in services (led by travel).
Compared to the third quarter of 2023, the deceleration in real GDP in the fourth quarter primarily reflected slowdowns in private inventory investment, federal government spending, residential fixed investment, and consumer spending. Imports decelerated.
Current‑dollar GDP increased 4.8 percent at an annual rate, or $328.7 billion, in the fourth quarter to a level of $27.94 trillion. In the third quarter, GDP increased 8.3 percent, or $547.1 billion (tables 1 and 3).
The price index for gross domestic purchases increased 1.9 percent in the fourth quarter, compared with an increase of 2.9 percent in the third quarter (table 4). The personal consumption expenditures (PCE) price index increased 1.7 percent, compared with an increase of 2.6 percent. Excluding food and energy prices, the PCE price index increased 2.0 percent, the same change as the third quarter.
Kevin Drum has a blog post on how Lindsey Graham allegedly threw Trump under the bus by telling the truth to a grand jury. But this is not what made me laugh. No it was this comment that I bet Moses will love:
‘Trump is a porkubus. It’s like an incubus or a succubus but it’s a massive demonic filthy pig that appears in your room in the dark of night and wallows around in your bed while you remain huddled in terror and revulsion in the furthest corner of the room perhaps behind a chair knowing that no one will believe you when you tell them what really happened and they’ll think you just did that yourself.’
Of course after reading this I bet I’ll have nightmares tonight!
When we thought JohnH could not go even lower – he exceeds all expectations. The latest dishonest tirade from this scum of the earth was to accuse our host of refusing to address real wages or inequality in his macroeconomics class. Our host has fired back at this lie and invited him to read his textbook which is Macroeconomics by the great Dr. Olivier Jean Blanchard. I specifically ask our lazy bastard to read chapter 7 which is a great discussion of Labor Economics.
Of course little Jonny boy has refused to do but now this clown says “endowed chairs” are paid by rich people to ignore this economic topic. Does little Jonny boy know the names of endowed chairs or professors in economics? Can he name one that refuses to address this topic? Of course not.
Let’s head over the economic department at MIT and note one such endowed professors is the same Dr. Olivier Jean Blanchard who has written on this topic including that Chapter 7 of Macroeconomics on Labor Economics. The chapter lying little Jonny boy refuses to read.
Johnny is a nobody who tries to hijack other folks good work to promote his agenda. kind of like a parasite. he cannot survive on his own. so he attaches to others as his only means of promoting his agenda. he would be dead without somebody else’s blog to infect. Johnny survives strictly because of the benevolence of others. but I recommend taking an antibiotic and cleansing the system.