Fed Chair Powell has suggested that the BLS birth-death model is overstating per month job creation by 60K since April. If so, nonfarm payroll employment is trending down.
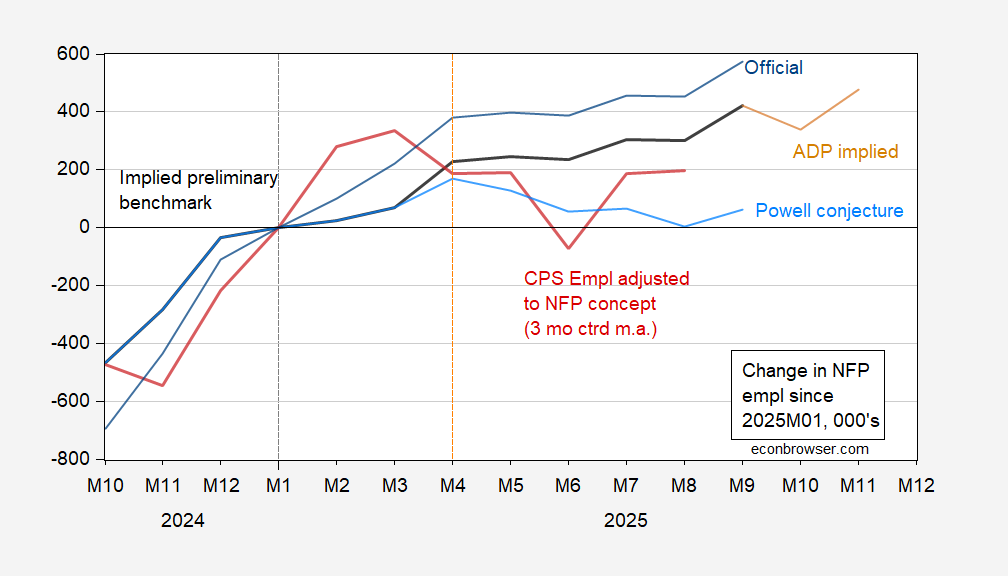
Figure 1: Official nonfarm payroll employment (blue), implied preliminary benchmark revision (bold black), ADP implied (tan), implied preliminary benchmark revision plus Powell conjecture (light blue), CPS employment series adjusted to NFP concept, experimental series with smoothed population controls (red), change since January 2025.
While official nonfarm payroll employment has grown a healthy 600K from January to September, the implied benchmark revision has only grown 400K over the corresponding period. Putting together the implied benchmark revision with the Powell conjecture, the NFP has only risen 61K since January.
In this context, the household survey employment series adjusted to the NFP concept is not too far off from this 61K level, at +200K in August. More interestingly, the adjusted household series peaked in March, the conjectured series in April.
Could we be in a recession? With many indicators still into positive range, it’s important to recall employment is one of the two key indicators followed by the NBER’s BCDC.
Is there any other coincident indicator to examine? In the past, I’ve used y/y growth in heavy truck sales.
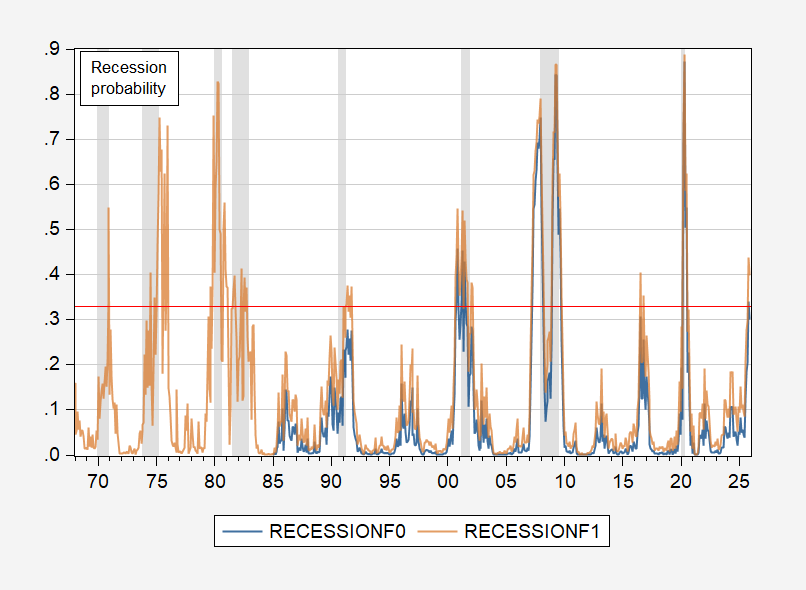
Figure 2: Estimated probability of recession from probit regression on 1968-2025M11 (tan), on 1986-2025M11 (blue). NBER defined peak-to-trough recession data shaded gray. Red dashed line at 33% threshold. Source: NBER, and author’s calculations.
Using a 33% threshold, a full sample probit has one false positive (2016), while a 1986-2025 probit regression has one false negative (1990-91). The October estimated probabiity using the restricted sample was 34%.
While this finding is intriguing, it’s important to recall that approaches like this rely upon historical correlations holding into the present. In other words, it’s important to consider what might be substantively different now. Case in point – a new 25% ad valorem tariff on heavy trucks (Section 232, USMCA value exempted), effective November 1st.
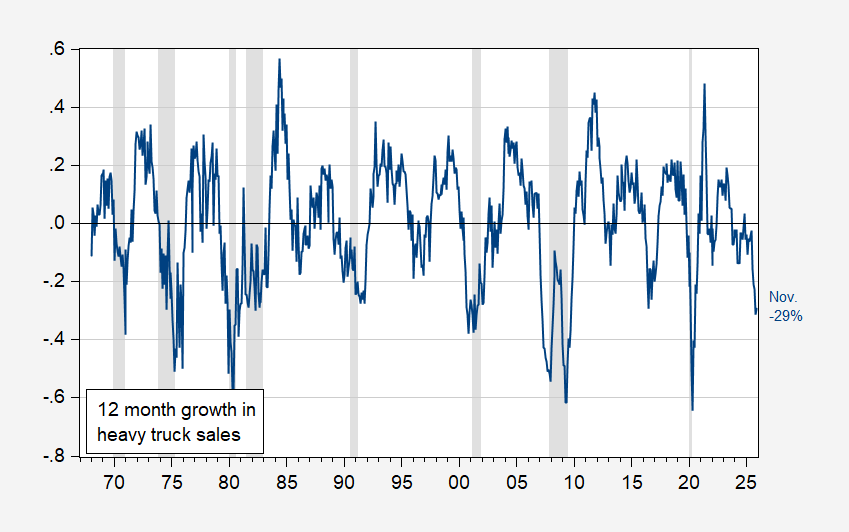
Figure 3: 12 month growth rate of heavy truck sales (blue). NBER defined peak-to-trough recession dates shaded gray. Source: Census via FRED, NBER and author’s calculations.
So, a cautionary note about reyling historical correlations in these unprecedented times.
I am pretty happy with VMT and recession. You can pick it right off the graph visually. The outlier is 1991, which has been an outlier in discussions here before.
https://fred.stlouisfed.org/series/M12MTVUSM227NFWA/
As for birth / death models, we have other sources of information about labor markets. One is IUC, which remain low by historical standards, and the other is job openings on JOLTS, which remain high by historical standards. I don’t see much impetus to reduce interest rates in either of those for the moment, even as inflation seems to remain elevated.
Btw, poor job creation would not surprise me. The Trump administration has taken a big bite out of undocumented labor, either because they have left the country or because they are reluctant to work. So, yeah, if you reduce the labor force, maybe job creation won’t look that good in an economy that is, as a practical matter, pretty close to full employment.
Steven Kopits: As discussed in this empirical discussion (which you commented on), VMT turns out to be a pretty poor predictor, given false negatives. In addition, over the same 2001-23 period, the McFadden R2 for 12 month changes in VMT is 0.06, while that for heavy truck sales is 0.36. Seriously, don’t you remember what you read/wrote a couple years ago?
Well, I can pick off the recessions just by looking at the 12 MMA VMT graph going back to 1970, with the exception of 2001. I’d note that I’ve long felt that the 1980-1982 recession was a single recession, not two as per NBER dating. In Europe, it’s a single recession.
If VMT is falling, then you’re either in recession or will be shortly. And it’s mostly a coincident indicator, at least on the way down.
this is called the steven kopits eyeball madness method.
Also, there’s merit in considering recessions as not only peak-to-trough, but peak-to-prior-peak. With that, it’s easy to distinguish between recessions, depressions and suppressions — and all three are readily identified on the VMT graph.
Why would we want to distiguish categories that you made up and no one else recognizes? That would be a waste of time. There are recessions (which in the past were called depressions) and expansions. That’s the whole list. The NBER’s business-cycle dating committee makes the call, not you.
Openings are widely understood to have undergone a progressive structural change – more openings for any given level of hiring:
https://fred.stlouisfed.org/graph/?g=1OMo5
The change is first evident around 2014 and has become exaggerated in the Covid era. With that change, historic openings levels seems a poor choice as an indicator.
If, instead, we look at hires and quits, representing the actual labor market behavior of firms and workers, we see evidence of weakness:
https://fred.stlouisfed.org/graph/?g=1OMns
If the reason for a slower pace of hiring is the lack of available workers because of immigration policy, why are quits weak? Shouldn’t workers who remain in the labor force be seeking out better jobs in a tight labor market? A low level of quits generally indicates weak labor demand, not a shortage of workers.
Comparing wage gains for job switchers and stayers tells the same story as quits:
https://www.atlantafed.org/chcs/wage-growth-tracker
Since April (there’s April again), there has been no wage advantage to changing jobs. If openings were high in reality, not just on job boards, lots of people would be quitting for higher wages. They aren’t, because changing jobs doesn’t get you better wages.
Powell’s conjecture, taken along with the FOMC’s latest economic projections, fits with the Committee’s newly happy assumptions about productivity.
Recall that labor productivity was reported rising at a 3.3% pace (SAAR) in Q2, with hours up 1.1%, with private non-farm output up 4.4% (GDP 3.8%). lf Powell’s 60,000/month guess is correct, hours worked in Q2 would be up more like 1.0%, productivity up 3.4% – not a big change. The highest productivity readings tend to be associated with recession and early recovery, but 3.4% is not high enough to suggest recession.
How about Q3? Aggregate weekly hours worked have been flat since May, in the official BLS stats:
https://fred.stlouisfed.org/graph/?g=1OM6U
If Powell’s conjecture proves correct, then hours were actually down in Q3, instead of flat. With GDP estimates running at 3.6%, productivity would have to rise even more than that to offset falling hours.
Powell talked a good bit this week about the possibility of a sharp rise in productivity. When Powell and Company raised next year’s GDP growth estimate by 0.5 ppt without much change in the jobless rate, it comes down to a guess that the U.S. economy is so flexible that it can more than offset weak employment growth over an extended period through productivity gains. That’s a pretty rosy assumption. It also allows the Committee to whistle past the inflationary effects of the felon-in-chief’s tariff, immigration and tax policies.
Baffling: “China has bought a quarter of the soybeans it promised trump to end trade war. So now trump will give $20 billion handout to farmers in welfare. And china can now buy top nvidia chips. This is called winning with trump? What a chaotic failure.”
Just more of Trump breaking the law. Trump is imposing a 25% export tax on the chips NVIDIA sells to China.
US Constitution Article I, Section 9, Clause 5:
No Tax or Duty shall be laid on Articles exported from any State.
There’s no ambiguity about it. Export taxes are flat out prohibited by the Constitution.
This is where the Supreme Court’s IEEPA, decision comes in. If the Court upholds the law in the IEEPA case, it might also uhold the Constitution in the NVidea export tariff case, should anyone with standing choose to bring such a case.
you think nvidea will take up a court case against trump? I will say, on these issues of extortion, trump has been playing chess while everybody else is playing checkers. his intimidation tactics (mob tactics) are intentional.