Remember “austerity” and “expansionary contraction” stories? Well, if you don’t, then gird yourself for another round of claims (primarily by non-macroeconomists) about how state and local governments need to tighten up their finances, by cutting spending (and cutting taxes to necessitate further spending cuts). Perhaps, we should consider expanding federal transfers to the states and localities…From the fourth round survey of the IGM/Fivethirtyeight Covid-19 panel:
Category Archives: budget
The Hill: “White House to forgo summer economic forecast amid COVID-19, breaking precedent”
That’s from an article today:
The White House will not release an updated round of economic projections this summer, breaking from precedent as the U.S. faces its deepest downturn since the Great Depression, two administration officials familiar with the decision confirmed to The Hill on Thursday.
Ma, Rogers, Zhou: “Global Economic and Financial Effects of 21st Century Pandemics and Epidemics”
Addendum, A new paper by Chang Ma, John H. Rogers and Sili Zhou:
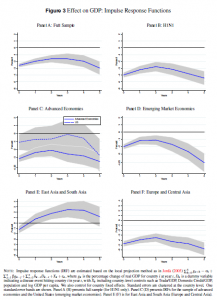
We provide perspective on the possible global economic and financial effects from COVID-19 by examining the handful of similar major health crises in the 21st century. We estimate the effects of these disease shock episodes on GDP growth, fiscal policy, expectations, financial markets, and corporate activity. Simple time-series models of GDP growth indicate that real GDP is 2.57 % lower on average across 210 countries in the year of the official declaration of the outbreak and is still 2.96 % below its pre-shock level five years later. The negative effect on GDP is felt less in countries with more aggressive first-year responses in government spending. Consensus forecast data suggests a pessimistic view on real GDP initially that lasts for two months, an effect that is larger for emerging market economies. Stock market responses indicate an immediate negative reaction. Finally, using firm-level data, we find a fall in corporate profitability and employment, and an increase in debt, the last of which is further reflected in higher sovereign CDS spreads.
Addendum, 4/1:
Impact on GDP growth expectations are illustrated in Figure 3:
One interesting (among many) policy relevant findings:
In countries with large responses of government expenditures, real GDP initially falls by 2.68% but the effect dies out in the second year. For the low government expenditure response countries, real GDP initially falls by 2.84%, an effect that is very persistent. Meanwhile, responses in government tax revenues do not make much of a difference.
How Plausible Is the Administration’s GDP Forecast?
As has been noted, the Administration’s forecast is about a percentage point higher than CBO’s. This seems like a large economic difference; as I’m teaching econometrics this semester, how does this seem in terms of statistical significance. Figure 1 below summarizes.
Where Did All the Stimulus Go?
By April 2018, the Tax Cut and Jobs Act and the Bipartisan Budget Act of 2018 had been put into law. The CBO projected a bump in GDP growth, relative to counterfactual. (According to the CBO, the TCJA alone should have pushed output 0.6 percentage points above baseline in 2019.) However, the actual record has been fairly plodding, as shown in the below figure.
Why Is the Structural Budget Deficit Blowing Up Since Trump?
The structural, or cyclically adjusted, budget balance has been deteriorating. In accounting terms, what’re the drivers?
When the Textbook Is Right: Implications of the Trump Fiscal/Trade Regime
Today we learned that through March, the Federal budget deficit was 15% larger than the corresponding point in the last fiscal year — as expected given a not particularly stimulative tax cut (so much for tax cuts paying for themselves, as Stephen Moore claimed) and the ending of spending restraints. The dollar remains at elevated levels, as interest rates have risen. The trade deficit, excluding petroleum, continues to deteriorate. As I explained to my macro class today… it’s all textbook (notes).
The Return of Global Imbalances (As Foretold)
Nearly a year ago, I asked Are Global Imbalances a Source of Concern?. At a minimum, we know they’re back. And the IMF certainly thinks so.
Guest Contribution: “An Economic Platform for the Democrats”
Today, we present a guest post written by Jeffrey Frankel, Harpel Professor at Harvard’s Kennedy School of Government, and formerly a member of the White House Council of Economic Advisers. An earlier version appeared in Project Syndicate.
The Reagan Tax Cuts and Defense Buildup: Supply-Side Miracle or Keynesian Stimulus?
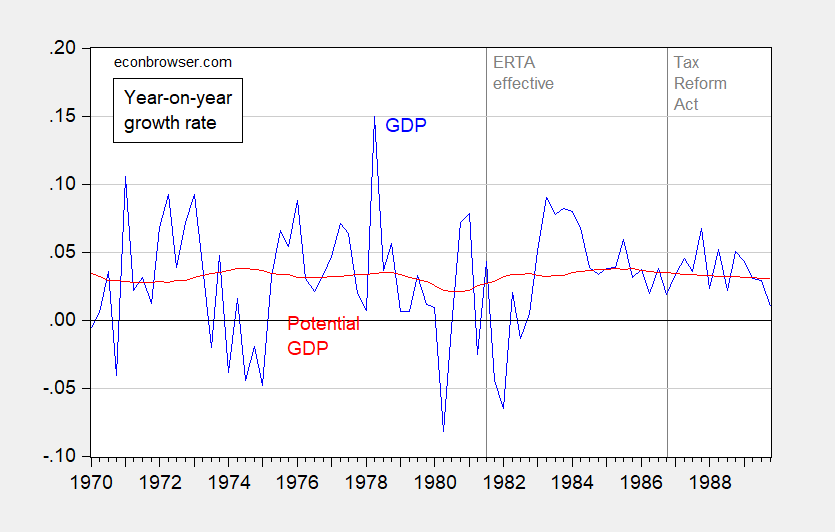
I keep on hearing about the supply-side miracle associated with the the Reagan era tax cuts. What do changes in estimated potential versus actual output suggest?

Figure 1: Year-on-year growth rate of real GDP (blue), and of potential GDP (red), calculated as 4th differences of logged values. Dashed lines at effective dates for Economic Recovery Tax Act of 1981 and Tax Reform Act of 1986. Source: BEA, CBO.
