Some idle speculation as we head into more closures: What if hospitality and leisure and retail employment dropped back to May levels, and the rest of nonfarm payroll employment increased by 2 million (it increased by 1.972 million in June). Then what would overall employment look like?
Category Archives: employment
Even Before the Recession, Employment Was Slowing
Quarterly Census of Employment and Wages data show the divergence from the establishment survey measurment of total employment in the months before the peak.
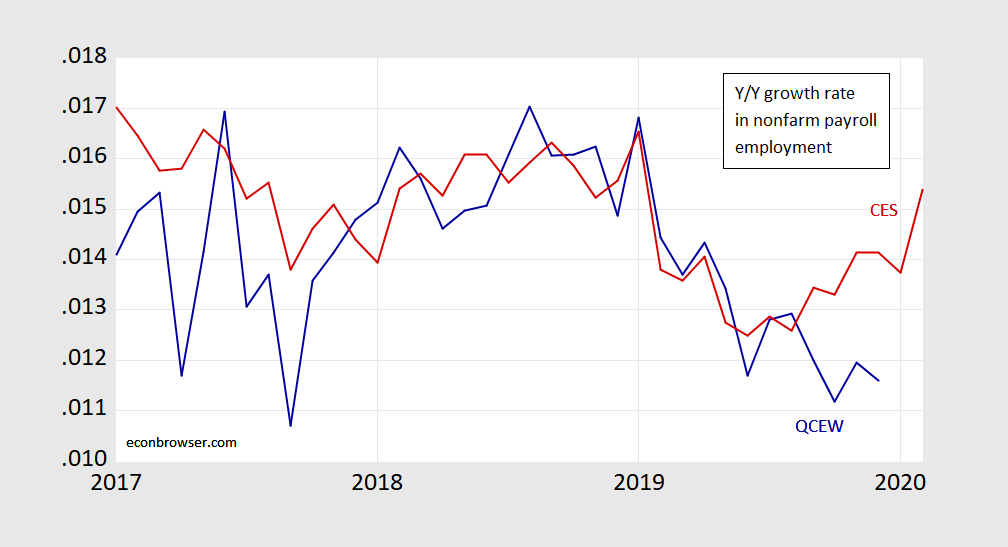
Figure 1: Year-on-year growth rate in nonfarm payroll employment from establishment survey (red), from Quarterly Census of Employment and Wages (blue), both calculated as 12 month log differences. Source: BLS, author’s calculations.
NBER identified peak is 2020M02.
Continued Recovery in June (II)
ADP releases its figure for private nonfarm payroll. Bloomberg consensus is for BLS is for an increase.
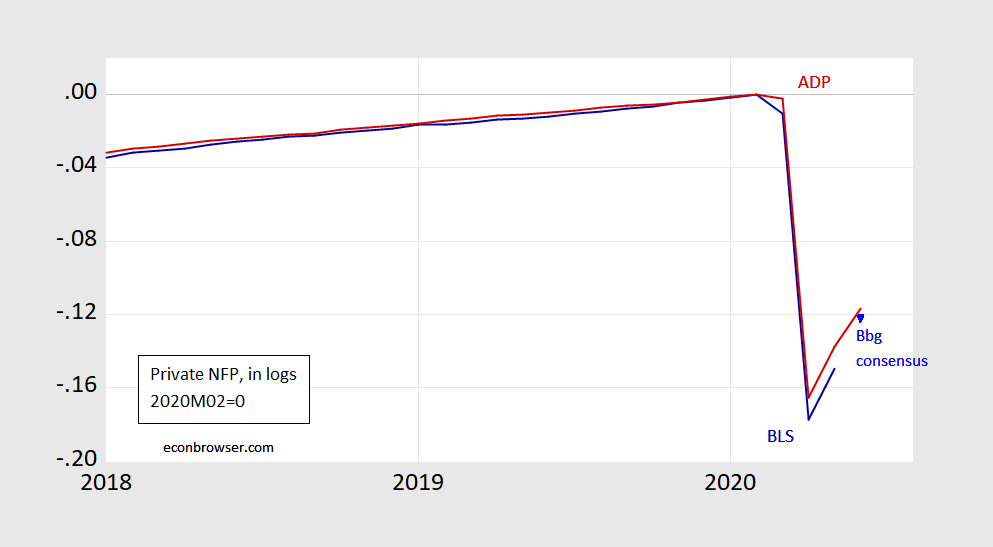
The obvious question: will July register an increase, as restrictions are re-instituted?
Guest Contribution: “Covid-induced precautionary saving in the US: the role of unemployment rate”
Today, we are pleased to present a guest contribution written by Valerio Ercolani, from the Directorate General for Economics, Statistics and Research at the Bank of Italy. The views expressed in this note represent that of the author and not necessarily reflect those of Bank of Italy.
Updated Wisconsin Economic Outlook
Just released (even as the Trump administration retains its January forecast), Wisconsin Economic Outlook June update. Employment is now forecasted to rise, at a higher level than earlier predicted. The implied pace of employment growth is almost the same as in May.
Interpreting the unemployment numbers
The Bureau of Labor Statistics announced Friday that 2.5 million more Americans were working in May than in April. That’s the biggest monthly increase since 1946, both in terms of the number of workers and as a percentage of the workforce. The unemployment rate dropped from 14.7% in April to 13.3% in May, the biggest monthly drop since 1950. All this is very good news. But there are also indications that we are in a deeper hole than the headline numbers suggest. Here I explain why I believe the true unemployment rate in May was a number more like 19.8%.
Continue reading
Business Cycle Indicators, April 6, 2020
Five key indicators followed by the NBER BCDC, as of today:

Figure 1: Nonfarm payroll employment (blue), industrial production (red), personal income excluding transfers in Ch.2012$ (green), manufacturing and trade sales in Ch.2012$ (black), and monthly GDP in Ch.2012$ (pink), all log normalized to 2019M01=0. Manufacturing and trade sales for February assumed to be at stochastic trend for 2018-2020M01. Source: BLS, Federal Reserve, BEA, via FRED, Macroeconomic Advisers (3/26 release), and author’s calculations.
Why I Still Think June 2019 Employment Is Lower than Reported
The data from the Quarterly Census of Employment and Wages (QCEW) suggests to me that employment in June 2019 (last available QCEW data) is 505 thousand lower than estimated (although possibly as little as 111 thousand, as large as 899 thousand, using a 95% prediction interval).
The Employment Benchmark Revision: Implications for the Economy’s Trajectory
The January numbers are out. March 2019 levels revised down 514 thousands, vs. 501 in preliminary. December numbers revised down 422 thousands. My guess based on December estimates and the March 2019 preliminary benchmark (see this post), the actual reported numbers for December were higher by 79 thousand.
DIY Benchmark Employment Release (Establishment)
Friday’s estimate of nonfarm employment will incorporate a benchmark revision, based on unemployment insurance and tax data extending up to 2019Q3. What will we see? Here’s an informed guess, based on what we see now (see the green line in Figure 1).