How much of the increase in the 10 year constant maturity Treasury yield is from higher real rates, and from higher expected inflation?
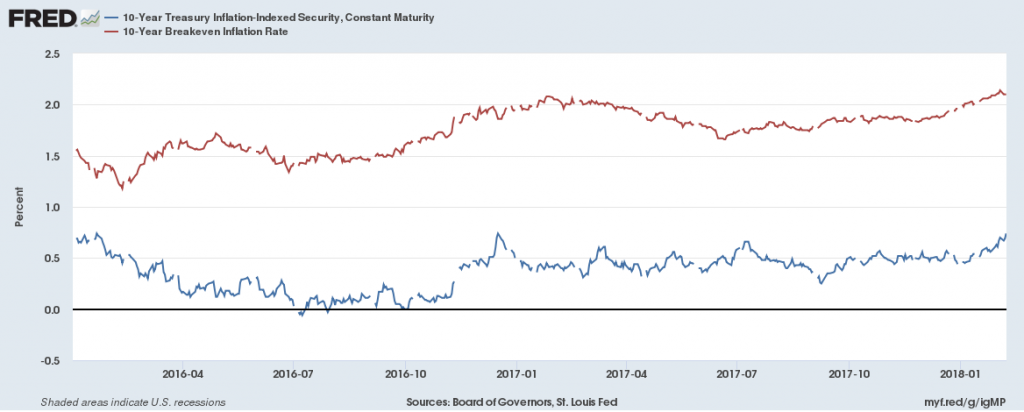
Source: Federal Reserve Board via FRED.
Recalling the Fisherian identity:
it = rt + πet
One can take the total differential:
Δit = Δrt + Δπet
Hence, of the 0.49 percentage point change from December 15 to February 7 in ten year Treasury yields, 0.27 percentage points is accounted for by a real interest rate increase, and 0.22 percentage point by inflation expectations boost (abstracting from liquidity premia, etc.).
Over the five year horizon, of the 0.41 percentage point change, 0.28 percentage points is accounted for by the real rate change, and 0.21 percentage point from higher expected inflation.
All about why nominal rates are rising, in interview with Marketplace (Stan Collender comments too). We talk about the standard things — tax cuts, spending increases, Fed QE unwinding and rate increases, and (my contribution) the deceleration of foreign central bank Treasury purchases (graphical depiction here on page 6). Discussion of the last point with respect to China here.
