Several people have asked me if the flattening yield curve is a warning of impending weak growth or even a recession. My answer is not yet. Here’s why.
Continue reading
Category Archives: recession
Is California in Recession (Part VII)
Back in mid-December, Political Calculations asked if California was in recession.
Going by these [household survey based labor market] measures, it would appear that recession has arrived in California, which is partially borne out by state level GDP data from the U.S. Bureau of Economic Analysis. [text as accessed on 12/27/2017]
The release of May state-level employment and coincident index figures provides an opportunity to revisit this question — it’s likely no recession occurred.
First, the coincident indicators for California and US:
Continue reading
Term Spreads in 2018: An Annotated History
Today, the 10 year-3 month spread ended below 1%, in the absence of safe haven effects. The 10 year-2 year spread ended at 0.35%.
Continue reading
Recession 2020?
Goldman Sachs (Hatzius et al., May 24):
Ongoing rate hikes are likely to tighten financial conditions, at least gradually, and we expect growth to slow to a trend pace through 2019 even with fiscal stimulus still helping. From 2020, when the fiscal impulse ends, the risk of recession looks set to rise, but the lack of cyclical excesses in borrowing and spending suggest that an outright contraction is far from a foregone conclusion—so long as Fed officials manage to prevent a big overheating.
How to Reduce the US-China Trade Deficit by $200 Billion: A Modest Proposal
Jim Tankersley/NYT discusses how hard it will be to reduce the $337 billion US-China gross trade deficit by $200 billion by increasing exports (as I point out in this post, our trade deficit in value added is probably about half the $337 billion).
The enormity of the task of cajoling the Chinese into buying $200 billion more is shown in Figure 1 (see the light blue arrow).
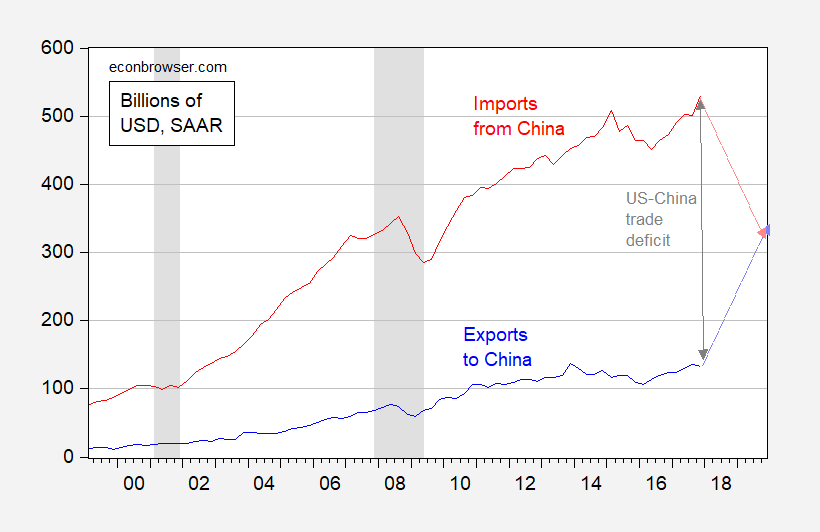
Figure 1: US exports to China (blue) and US imports from China (red), in billions of USD, SAAR. NBER defined recession dates shaded gray. Increasing exports to China by $200 billion over two years (light blue arrow); decrease imports from China by $200 billion over two years (pink arrow). Source: BEA/Census, NBER, author’s calculations.
A much simpler way to reduce the deficit; instead of browbeating the Chinese into buying $200 billion dollars more, just throw the US economy into a deep, deep recession, and reduce US imports from China (the pink arrow).
In Cheung, Chinn and Qian (Review of World Economics, 2015), we estimate the income elasticity of US imports from China is in the range of 2.6 to 3.4 (Table 3). $200 billion is about 0.40 of $506 billion (US imports from China). Assuming a high income elasticity of 3.4, all we need to do is reduce US GDP by 11.6% (about $2.32 trillion in for US nominal GDP of nearly $20 trillion in 2018Q1). Of course, this is ballpark, particularly because many things would not stay constant — the USD/CNY exchange rate would doubtless change, as would US exports to China. But you get the idea.
Now one could say this is a crazy idea; I say it’s no more crazy than building a wall with Mexico and forcing them to pay, banning all immigrants from s***hole countries, doubling Amazon’s shipping costs with the US postal service, collaborating with the Russians on cybersecurity, implementing a border adjustment tax, arming teachers to protect students, and a myriad of other Trump musings.
How Many Times Have the 10y2y and 10y3m Spreads Concurrently Broken the 1% and 0.5% Thresholds w/o Subsequent Recession?
If one uses a three year window, it’s three times: February, 1986, May 1995, September 1997. Three other times, a recession follows.
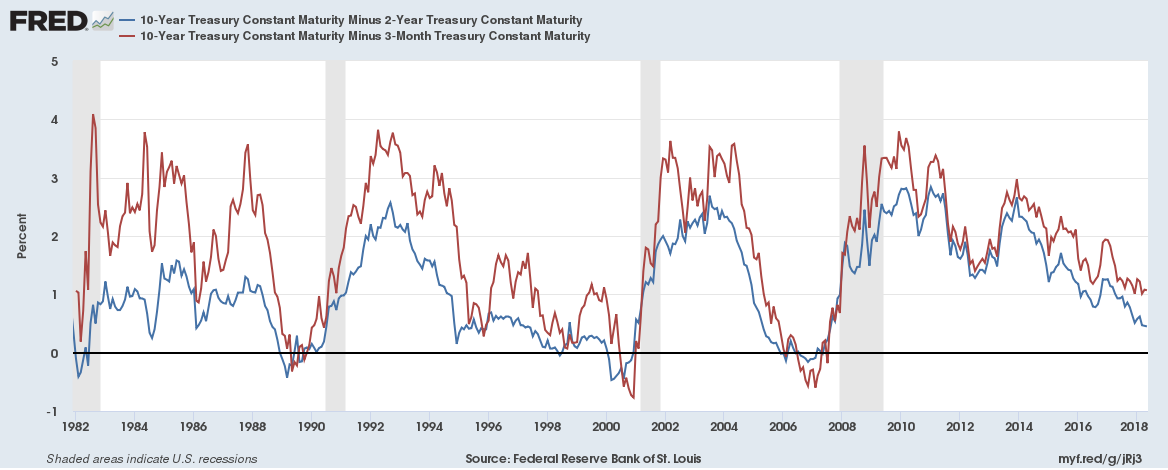
The last time around — when people were saying “this time is different” — was May 2005. Inversion occurred in February 2006 (and in November 2006, skepticism of impending recession). The recession is dated by NBER as starting in December 2007.
For additional discussion of the implications of a flattening yield curve, see Michael Klein’s EconoFact article, and (for cross country empirics) Chinn and Kucko (2015).
Is California in Recession? (Part V)
Back in mid-December, Political Calculations asked if California was in recession. Following last week’s state-level GDP release for 2017Q4 and Philadelphia Fed indices from a week and a half ago — it’s likely no recession occurred, and is currently not occurring.
Six Pictures of the US Macroeconomy
As I prepped for final lectures in my macro policy course, I generated these graphs.
Nowcasting the US Economy:
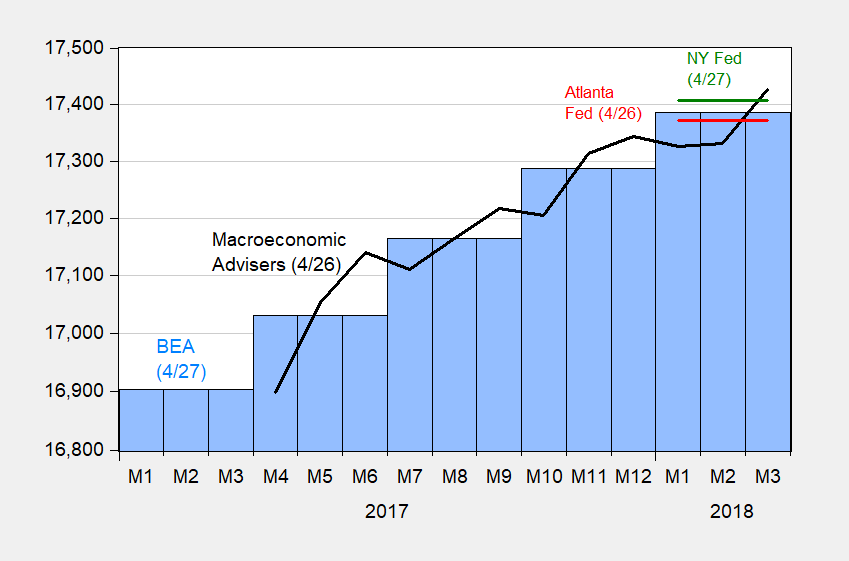
Figure 1: Reported GDP (blue bars), Atlanta Fed GDPNow (red), NY Fed nowcast (green), and Macroeconomic Advisers (black), all in billions Ch.2009$ SAAR, on log scale. Source: BEA 2018Q1 advance; Atlanta Fed (4/26), NY Fed (4/27), Macroeconomic Advisers (4/26).
Yield Curves Flattening in High Income Countries
A recent article on the predictive abilities of yield curves (Shrager/Quartz) includes a nifty interactive which allows you to look at yield curves over time. Below, I do a snapshot comparison, across the world.
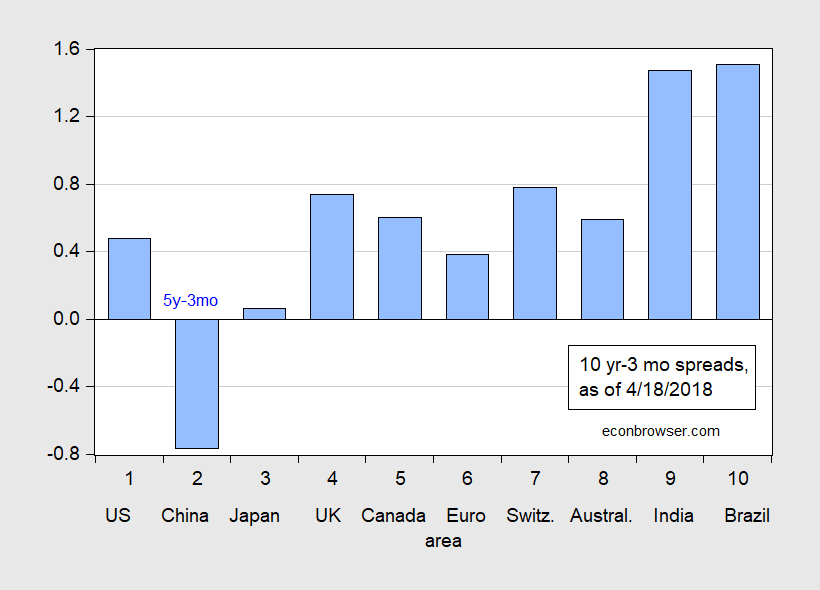
Figure 1: Ten year-three month term spread (blue bars), as of 9 July 2016. China observation is Five year-three month term spread. Euro ten year rate is for Germany. Source: Economist, data as of April 18.
Continue reading
Larry Kudlow Forecasts
Mr. Kudlow is apparently on the short list for new National Economic Committee chair. Maybe a good time to review some of his macro predictions.
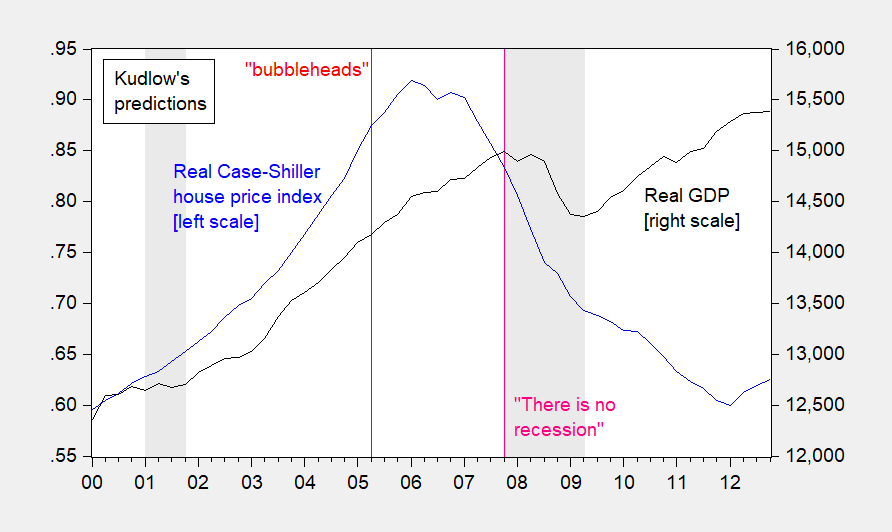
Figure 1: Case-Shiller US National Home Price Index, s.a., deflated by CPI-all (blue, left scale), and real GDP, bn. Ch.2009$ SAAR (black, right scale). NBER defined recession dates shaded gray. Red line at 20 June 2005 comment on housing bubble, and pink line at 7 December 2007 on recession. Source: S&P, BLS via FRED, BEA (2017Q4 2nd release), NBER, and author’s calculations.