Janet Yellen ended her term as Chair of the Federal Reserve today.

Source: Federal Reserve
Continue reading
Janet Yellen ended her term as Chair of the Federal Reserve today.
Source: Federal Reserve
Continue reading
Or, Does Mr. Trump feel lucky?
From EconoFact:
The agriculture sector in the United States depends upon exports for its vitality. Sales of U.S. agricultural products abroad are responsible for 20 percent of U.S. farm income, supporting more than one million American jobs on and off the farm, according to the U.S. Department of Agriculture. The three biggest buyers of American agricultural products are China, Canada, and Mexico. Yet trade with these three countries faces heightened uncertainty. The Trump Administration initiated a process of renegotiating the North American Free Trade Agreement (NAFTA) with Canada and Mexico, which includes the option of exiting the deal altogether. In addition, the United States has started a series of investigations of unfair practices leveled against China, some of which have already resulted in the imposition of new tariffs. These trade policy initiatives threaten agricultural exports both because of the potential increase of tariffs on exports to Canada and Mexico that would result from a withdrawal from NAFTA as well as the very real threat of retaliation in response to other proposed policies.
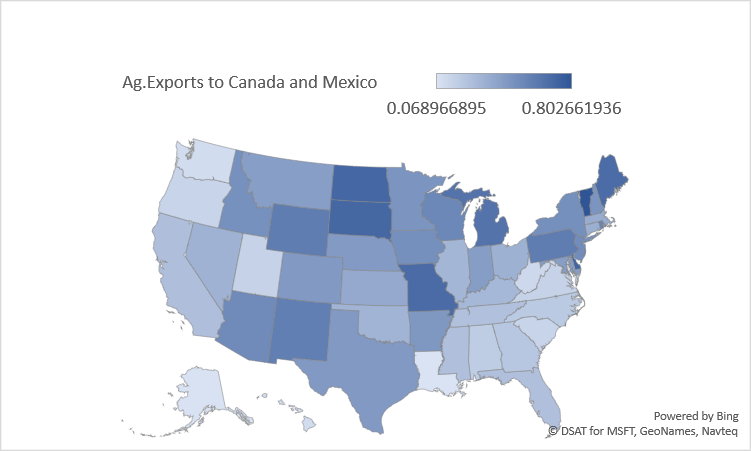
Figure 1: Share of total agricultural exports going to Mexico and Canada, by state. Agricultural exports defined as NAICS 111+112+311 (crops, livestock, and processed food). Source: Census via ITA and author’s calculations.
The entire article is here. More on agricultural sector fortunes here.
we’d have had over 340,000 more jobs in December. And over 380,000 more jobs in January
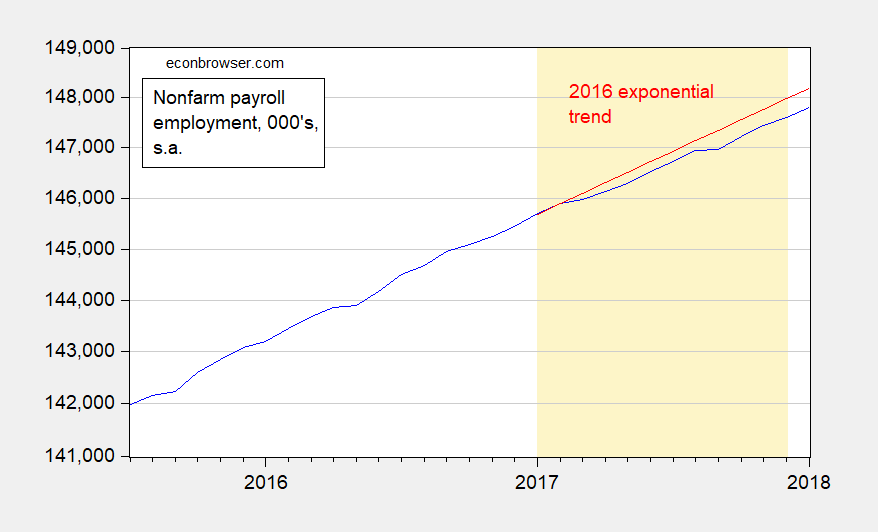
Figure 1: Nonfarm payroll employment (blue), and 2016 linear deterministic exponential trend set to match 2017M01 value (red), in 000’s, seasonally adjusted, on log scale. Orange shading denotes 2017 data. Source: BLS December 2017 January 2018 release, author’s calculations. (updated 2/2)
Now that Brownback is an ex-governor, and the tax plan he touted as a “shot of adrenaline” is largely reversed, it’s a good time to see what damage was wrought.
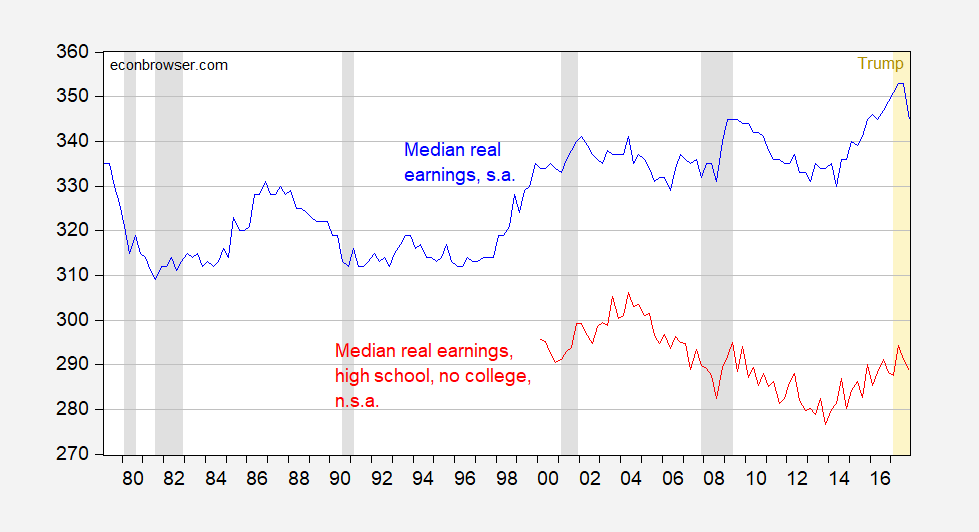
Figure 1: Employed full time: Median usual weekly real earnings for Wage and salary workers, 16 years and over, 1982-84 CPI Adjusted Dollars, seasonally adjusted (blue), and Employed full time: Median usual weekly nominal earnings (second quartile)f or Wage and salary workers, High School graduates, no college, 25 years and over, seasonally adjusted, deflated by CPI, not seasonally adjusted (red). NBER defined recession dates shaded gray. Orange shading denotes Trump administration. Source: BLS via FRED, and author’s calculations. (updated 8:30PM Pacific)
So far, so-so.
The Bureau of Economic Analysis announced today that U.S. real GDP grew at a 2.6% annual rate in the fourth quarter. That is better than the 2.2% we’ve seen on average since the Great Recession ended in 2009, though below the historical average growth rate for the U.S. economy of 3.1%.
Here are GDP series for Wisconsin, as compared to Minnesota and the Nation, normalized to 2011Q1 when Governor Walker took office. I’ve indicated the implementation of the Manufacturing and Agriculture Credit, and percentages, as well.
State level data for GDP in 2017Q3 were released yesterday. This is an opportunity to evaluate the progress of manufacturing value added (as opposed to employment) in Wisconsin after passage of the Manufacturing and Agriculture Credit (MAC).
The release of labor market indicators suggests not, contra some recent commentary.
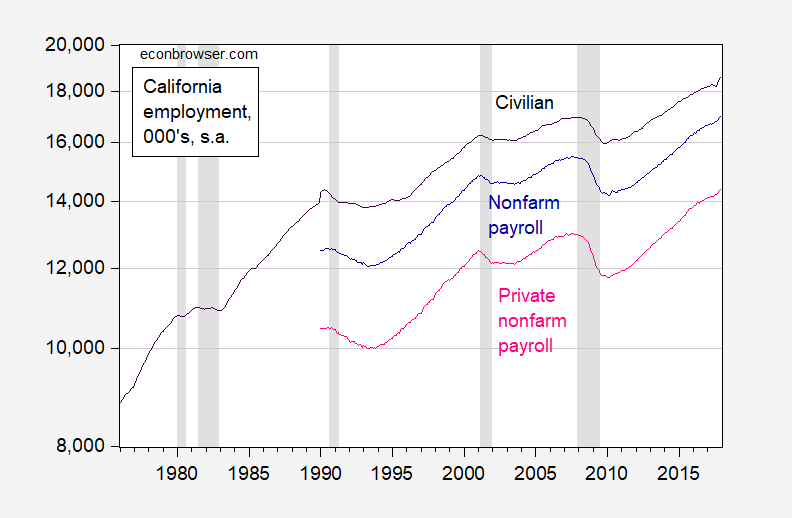
Figure 1: California civilian employment over age 16 from household survey (black), nonfarm payroll employment (dark blue), private nonfarm payroll employment (pink) from establishment survey, all in thousands, seasonally adjusted, on log scale. NBER defined recession dates shaded gray. Source: BLS and NBER.
Continue reading