Since President-elect Trump has nominated Peter Navarro* to direct the newly formed Trade Policy Council, now seems a good time to review some trade data.
Post-Brexit Out-of-Sample Forecasted Electricity Consumption
Take England+Wales log daily electricity consumption, detrend using Christiano-Fitzgerald band pass filter, and then regress on seasonal (calendar) terms, and temperature/wind/rain factors (Kirchmaier and de Guana de Santiago, 2016, h/t Simon Kennedy at Bloomberg), through April 2016. Then forecast out of sample; the residual looks like this:
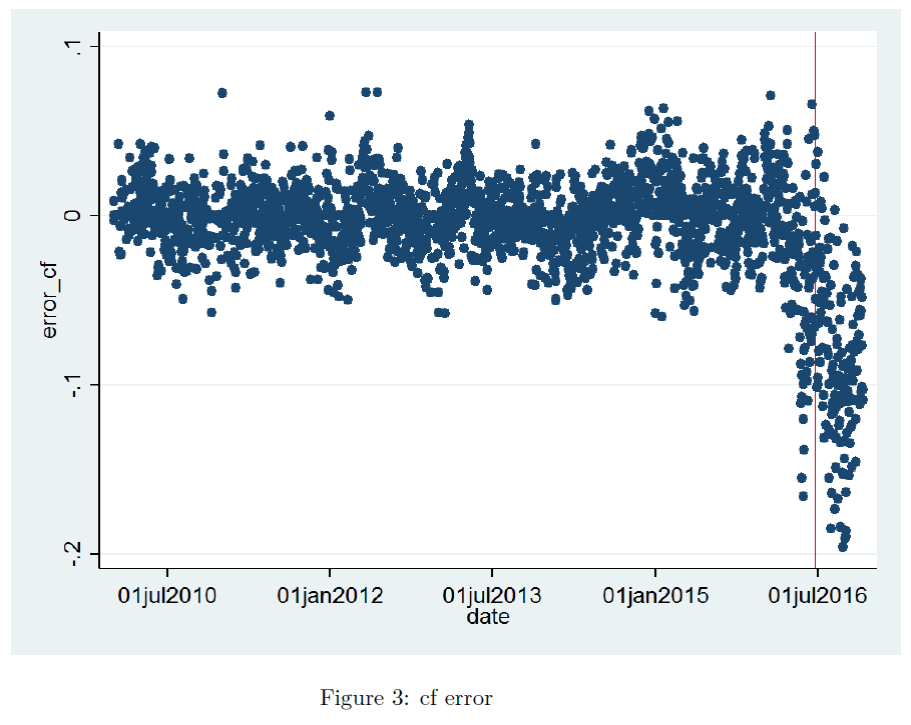
Figure 3 from Kirchmaier and de Guana de Santiago, (2016).
Electricity consumption is way under what would be expected from historical correlations, suggesting a decline in economic — particularly industrial — activity.
While monthly estimates of November GDP are up 1.1% relative to June, industrial output is down by 1.2%, according to NIESR (Dec. 7).
It is always useful to keep in mind that economic statistics are sometimes revised by large amounts.
Guest Contribution: “Five Key Factors for 2017”
Today, we present a guest post written by Jeffrey Frankel, Harpel Professor at Harvard’s Kennedy School of Government, and formerly a member of the White House Council of Economic Advisers.
Back to normal?
A year ago, the Federal Reserve decided to raise its target for the fed funds rate by 25 basis points above the floor of 0-0.25% at which we’d been stuck for 7 years. FOMC members indicated at the time that they were expecting to end 2016 at 1.4%, or four rate hikes during the last year. We started this December at 0.41%, and the first hike of 2016 didn’t come until last week. Now FOMC members say they are expecting to end 2017 at 1.4%, or three more hikes from here during the next year. The January 2018 fed funds futures contract is currently priced at 1.23%, suggesting that the market is buying into two, not three hikes during 2017.
Continue reading
Sound and Fury Signifying…? Mulvaney to OMB
A Big MacParity Guide to Undervalued Currencies
China is not high on the list for “day one sanctions” if one were to look at this fast-food data.
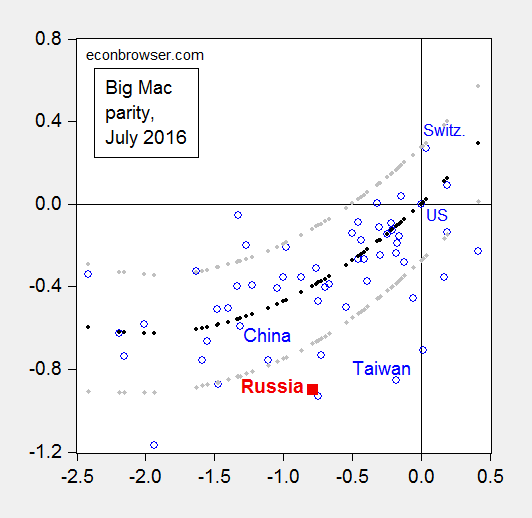
Figure 1: Log relative dollar price of Big Mac against dollar price of US Big Mac (July 2016) versus log relative per capita income in PPP terms (2016 estimates); regression fit from quadratic specification (black dots), and 90% prediction interval (gray dots). Source: Economist, World Bank World Development Indicators, and author’s calculations. Data [XLSX]
Using the methodology outlined in this post, it’s clear that by the price criterion, Russia’s currency is much more undervalued (at 50% in log terms) than China’s.
Kansas Employment Decline Continues
Missouri employment rises.
“The Future’s So Bright, I Gotta Wear Shades”
That’s what Governor Walker said today about Wisconsin’s economy, quoting from a 1980’s song. This was apparently spurred by DWD’s release “Wisconsin Employment Reaches All-Time High in November”. This statement is true, when referring to the relatively imprecisely measured household survey figures [1]. It is not true when referring the (more precisely measured) establishment series.
Economic Report of the President, 2017
When Tax Cuts Meet Mass Deportations
As we get more clarity on the nature of fiscal and mass deportation policies under a Trump Administration, it seems useful to consider what happens to the output gap.