According to the BLS, nonfarm employment rose only 115,000, as government payrolls shed 15,000. The household series adjusted to conform to the NFP concept indicates an additional 1.6 million employed relative to the official series. Private sector employment now exceeds levels of 2009M01, while aggregate hours worked exceeds by 1.9% (in log terms). With revisions to the February and March data, average employment growth is 207 thousand in the first four months, as compared to 210 thousand, from the first three months indicated in the March release.
Thinking about the Double Dip Recession in the UK
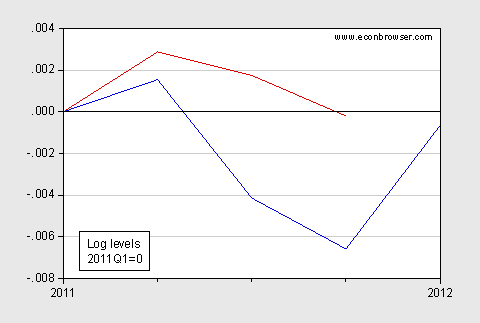
The news is well-known now: There the UK is in the first double dip recession since 1975 thanks to among other things the government’s contractionary fiscal policies. This recovery is in fact worse than that of the Great Depression [Macroscope] Here are three other observations that might not be so obvious: (1) Growth has been lackluster ever since the election of the coalition government in May 2010; (2) growth under the program of austerity has compared poorly against the (admittedly insufficiently stimulative) fiscal policy framework in the US, and; (3) UK GDP growth has been lackluster even with the depreciated pound, which is interesting given that exchange rates can act as a shock absorber.
Should the Fed do more?
Johns Hopkins University Professor Larry Ball, Princeton Professor Paul Krugman, U.C. Berkeley Professor Brad DeLong, University of Oregon Professor Tim Duy and Texas State University Professor David Beckworth are among those recently arguing that Fed Chairman Ben Bernanke is neglecting his own earlier academic insights into what the central bank should be doing in a situation such as the United States presently finds itself. Here’s what I think they’re overlooking.
No Need to Wait until June 5
From WisPolitics today:
Walker warned that job losses might again ramp up in Wisconsin if either Barrett or Falk are elected in the June 5 recall…
Sluggish U.S. growth continues
The Bureau of Economic Analysis reported today that U.S. real GDP grew at a 2.2% annual rate during the first quarter, down from the 3.0% growth of 2011:Q4, and below the 2.4-2.9% range that the FOMC indicated yesterday it is anticipating for 2012 as a whole. I see some reasons to agree with the Fed that the rest of the year may be slightly better than the first quarter.
Labor Market Interventions and Learning from Other Countries
As documented in Box 1-2 in the IMF’s latest World Economic Outlook, unemployment in the advanced economies remained persistently high. That brings to the fore how to best deal with adjusting the labor force so as to bring down structural unemployment (although obviously higher aggregate demand would help). In my view, there is the “are there no poorhouses?” approach (cut unemployment benefits, etc. and thus reduce the natural rate of unemployment). The other is to use evidence-based approaches to improve the labor force quality, and improve job matching, thereby decreasing structural unemployment. This alternative is discussed in a recent La Follette Policy Report, by Robert Haveman, Carolyn Heinrich, and Timothy Smeeding, entitled “Policy Responses to the Recent
Poor Performance of the U.S. Labor Market”:
More on speculation
In addition to my discussion last week on the role of speculation in oil markets, let me call attention to commentary from some of my academic colleagues on the same topic:
University of Michigan Professor Lutz Kilian
What Are These Two Time Series?
The geography of unemployment
Some quick remarks on the unevenness of the U.S. economic recovery.
Gasoline Price Trends According to Futures
From the WSJ yesterday:
After a sizzling start to the year, gasoline futures prices are sliding, easing pressures on drivers and the U.S. economy and raising the prospect that prices at the pump could be headed lower still.
