Employment numbers for June were released for today.
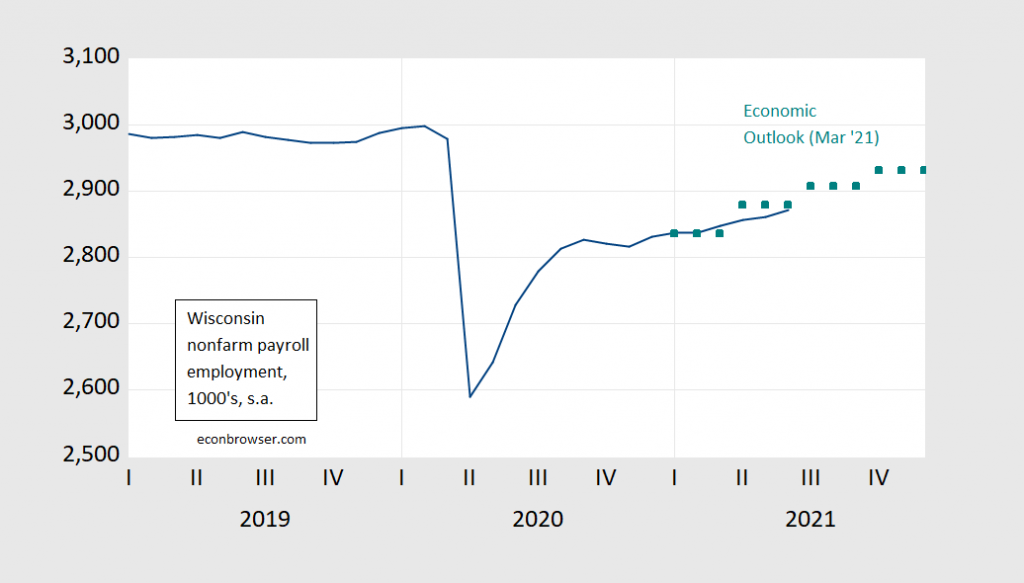
Nonfarm payroll employment and the March 2021 Outlook forecast:
Figure 1: Nonfarm payroll employment from April release (blue), forecast from March 2021 Economic Outlook (teal squares), all in 000’s, seasonally adjusted. Source: BLS, DWD, and Wisconsin Department of Revenue.
Nonfarm payroll employment in June was a bit below the DoR’s forecasted level for Q2, growing 4.6% annualized, way down from a year ago (47.1%), but still above recent months. 4.6% is a bit slower than the national pace of 7.3%. The halting pace of job growth could be due to any number of factors, but the argument that enhanced unemployment benefits is not clearly the cause as of May has not yet validated by any formal studies I’m aware of. The total number of unemployed were essentially constant April to June. As of June, WIsconsin NFP is down 4.3% as compared to 4.5% nationwide.
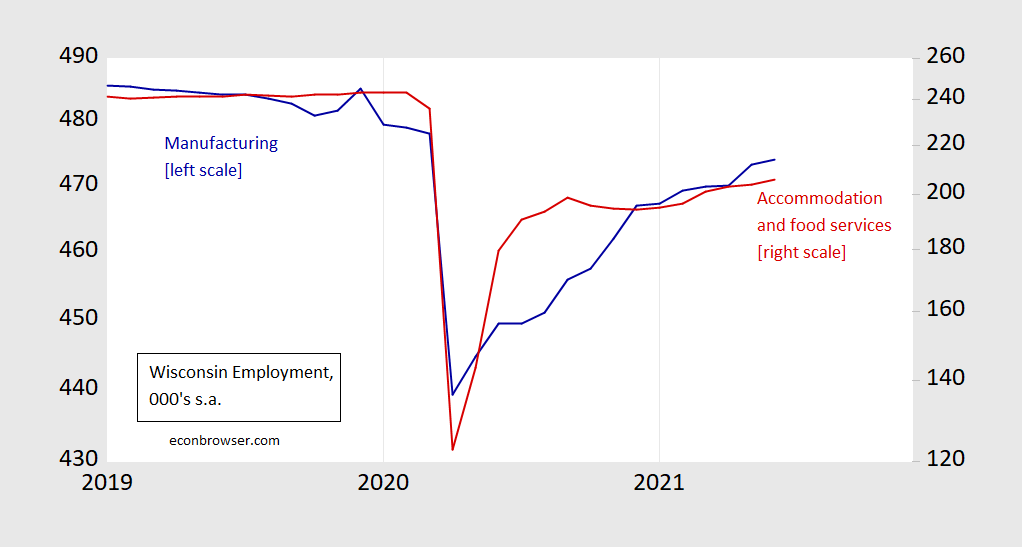
It’s important to recall the dualistic nature of the recovery, in particular the fact that high contact services employment remains more depressed than that for goods production. The recovery in accommodation and food services seems to have stalled (according to seasonally adjusted numbers), while manufacturing employment has resumed its rise.
Figure 2: Wisconsin manufacturing employment release (blue), and accommodation and food services employment (red, right log scale), all in 000’s, seasonally adjusted. Source: BLS, and DWD.
Manufacturing employment is 1.0% below February 2020 levels, while accommodation and food services are down 16.7% (on a seasonally adjusted basis), log levels.
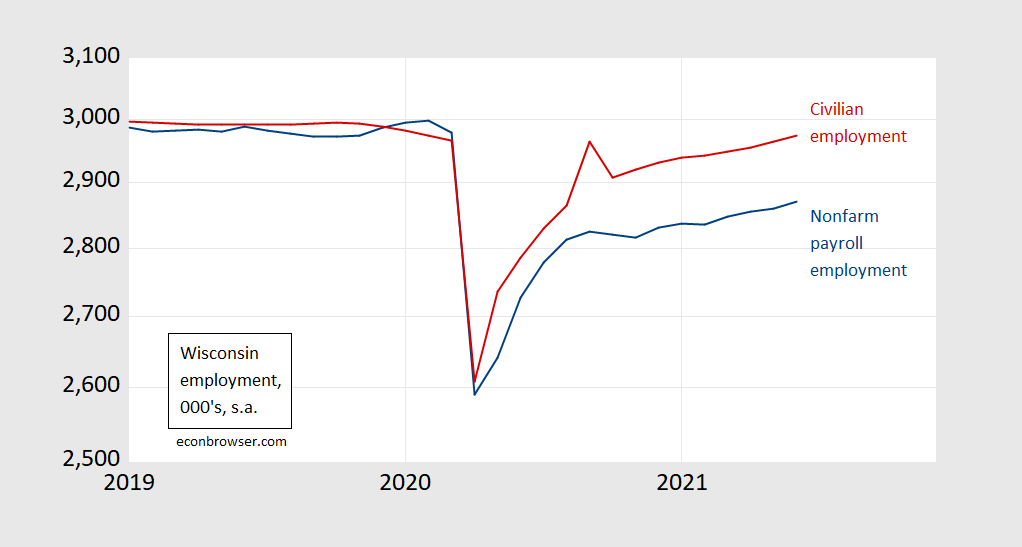
Finally, we can look at how the other employment measure is tracking the labor market.
Figure 3: Nonfarm payroll employment (blue), and civilian employment (red), all in logs, 2020M02=0. Source: BLS via FRED.
Both series are rising, with nonfarm payroll employment showing faster growth in June. Civilian employment, based upon the household instead of establishment survey, shows lower growth, but is much more imprecise, and subject to large revisions. In that case, it might be better to rely on the year-on-year numbers, where civilian employment has grown 6.7% vs. 5.3% for NFP.
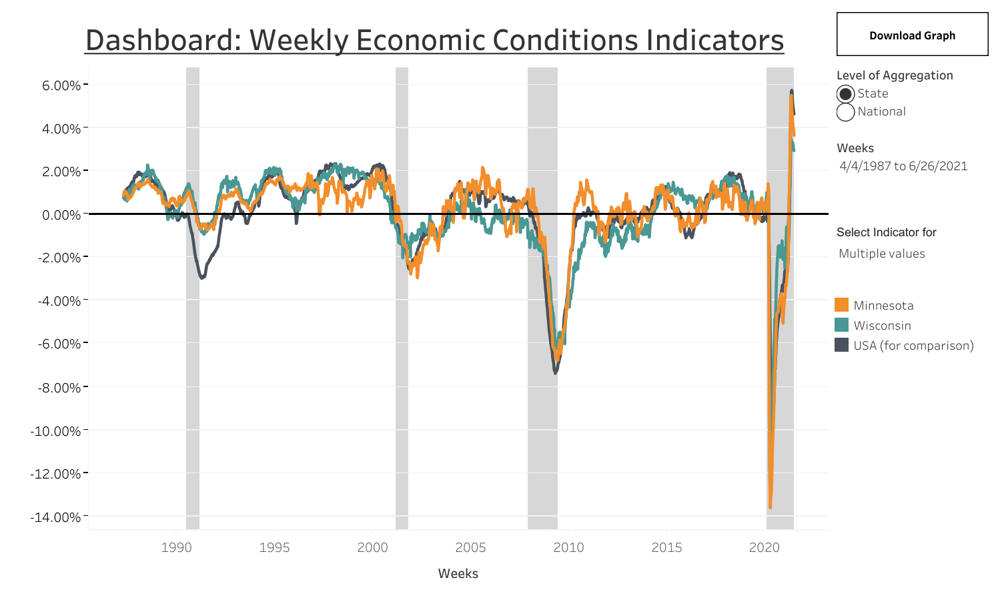
I typically refer to the labor market data for Wisconsin because employment is reported with the shortest lag among the official statistics. However, tools recently developed by Baumeister, Leiva-León, and Sims allow for higher frequency tracking, as described here and here. Here is weekly tracking of Wisconsin vs. Minnesota vs. the US., through June 26, from their dashboard.
Source: Baumeister, et al.
This measure indicates that Wisconsin economic activity growth peaked the week ending May 1st and is still at an extraordinarily high rate in the week ending June 26th.


“it might be better to rely on the year-on-year numbers, where civilian employment has grown 6.7% vs. 5.3% for NFP.”
I agree that the household survey shows a lot of month by month noise so the year by year comparison is more appropriate. But even then the payroll survey shows a lot less growth than the household survey.
https://fred.stlouisfed.org/graph/?g=EQlT
January 15, 2018
Per capita personal income for Minnesota a percent of United States, 1929-2021
https://fred.stlouisfed.org/graph/?g=EQlW
January 15, 2018
Per capita personal income for Wisconsin as a percent of United States, 1929-2021
https://fred.stlouisfed.org/graph/?g=EQm0
January 15, 2018
Per capita personal income for Michigan as a percent of United States, 1929-2021