This despite Trump’s temporary delay on additional China tariffs.
This despite Trump’s temporary delay on additional China tariffs.
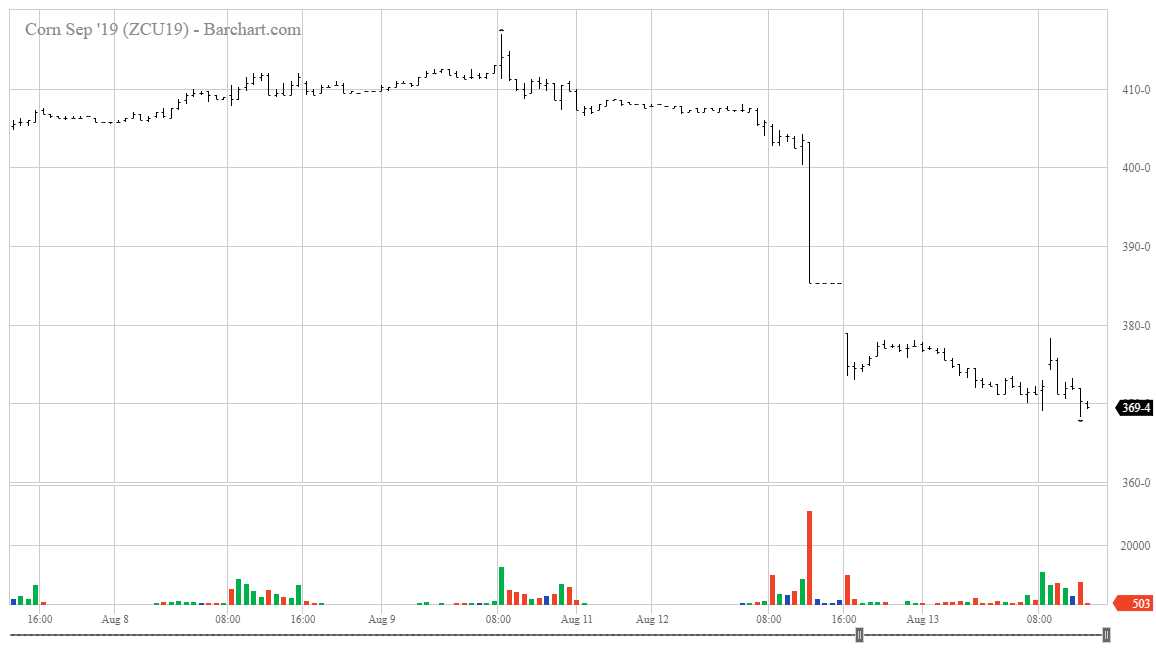
Figure 1: September 2019 corn futures, accessed 8/13/2019. Source: Barchart.com.
A picture is worth a thousand words.
Today, we present a guest post written by Jeffrey Frankel, Harpel Professor at Harvard’s Kennedy School of Government, and formerly a member of the White House Council of Economic Advisers. A shorter version appeared in Project Syndicate on August 9th.
I get to teach Public Affairs 854, “Macroeconomic Policy and International Financial Regulation” and Economics 435 “The Financial System” this fall. There’s a cosmic confluence this year, in terms of the subject:
Donald Trump’s pronouncements can typically be taken as contra-indicators. In other words, what he says is invariably wrong. So, you gotta wonder on China…
Continue reading
No end to “the blip“. From today’s Des Moines Register:
A collection of JEP articles readers have cited as useful for instruction, by category:
On July 9, 2018, almost exactly a year ago, reader CoRev wrote:
Those of us arguing against the constant anti-tariff, anti-Trump dialogs have noted this will probably be a price blip lasting until US/Chinese negotiations end. We are on record saying the prices will be back approaching last year’s harvest season prices.
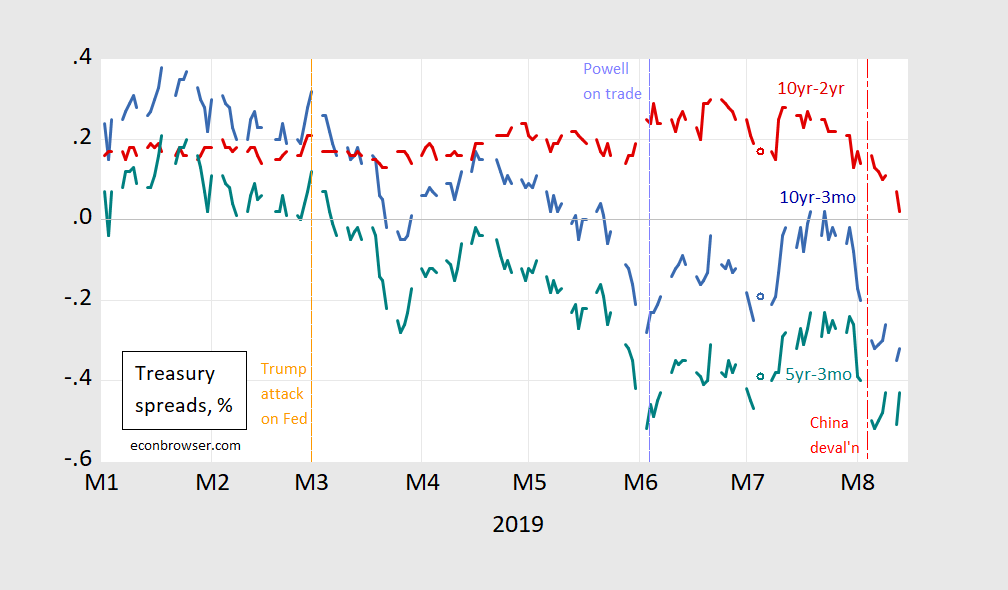
Asset price movements around “news” regarding policy can illuminate the market’s assessment of the outlook for trade policy. Looking at a small window (say half hour) around an event can allow one to separate other factors (weather, other demand factors) from other. With that, let’s look at soybean futures (September 2019)…