Today, we’re pleased to present a guest contribution by Rob Fairlie (UC Santa Cruz).
Category Archives: recession
Guest Contribution: “A Severe US Recession”
Today, we’re pleased to present a guest contribution written by Laurent Ferrara (SKEMA Business School and International Institute of Forecasters) .
Interpreting the unemployment numbers
The Bureau of Labor Statistics announced Friday that 2.5 million more Americans were working in May than in April. That’s the biggest monthly increase since 1946, both in terms of the number of workers and as a percentage of the workforce. The unemployment rate dropped from 14.7% in April to 13.3% in May, the biggest monthly drop since 1950. All this is very good news. But there are also indications that we are in a deeper hole than the headline numbers suggest. Here I explain why I believe the true unemployment rate in May was a number more like 19.8%.
Continue reading
Guest Contribution: “Global financial markets and oil price shocks in real time”
Today, we are pleased to present a guest contribution written by Fabrizio Venditti (European Central Bank) and Giovanni Veronese (Banca d’Italia). The views expressed in this paper belong to the authors and are not necessarily shared by the Banca d’Italia and the European Central Bank.
Forward Looking Economic Activity, Pre-Covid19
The economy is collapsing. That’s not news. What is interesting is that nonresidential fixed investment has been falling since 2019Q1.
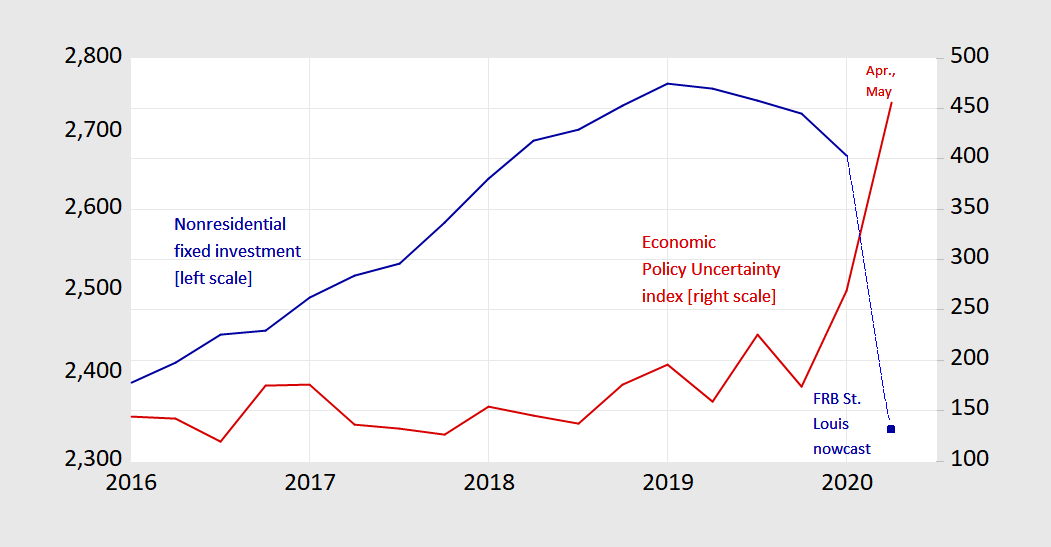
Figure 1: Nonfarm fixed investment in billions Ch.2012$ SAAR (blue, left log scale), and Economic Policy Uncertainty index (red, right scale). 2020Q2 investment is St. Louis Fed nowcast as of 6/1; 2020Q2 EPU is for first two months, as of 6/1. Source: BEA 2020Q1 2nd release, St. Louis Fed FRED, policyuncertainty.com and author’s calculations.
Business Cycle Indicators, 30 May 2020
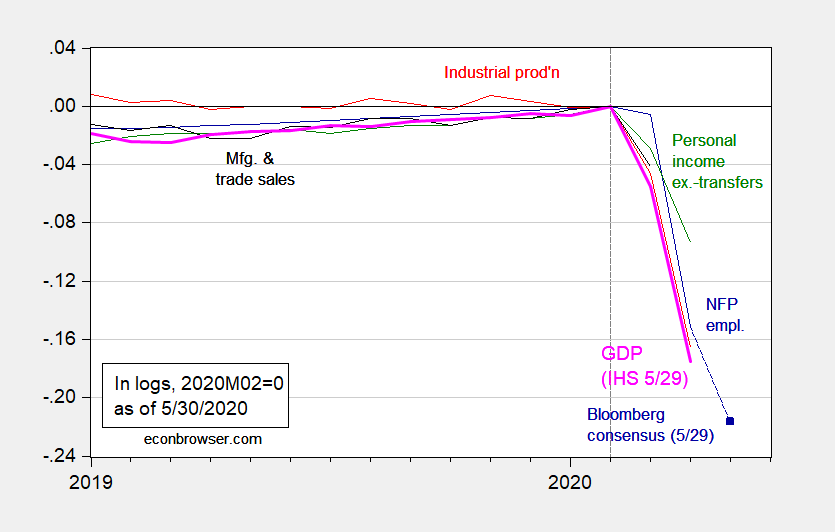
Figure 1: Nonfarm payroll employment (blue), industrial production (red), personal income excluding transfers in Ch.2012$ (green), manufacturing and trade sales in Ch.2012$ (black), and monthly GDP in Ch.2012$ (pink), all log normalized to 2019M02=0. Source: BLS, Federal Reserve, BEA, via FRED, Macroeconomic Advisers (5/29 release), Bloomberg, and author’s calculations.
As of Friday, May 29th, NY Fed, Atlanta Fed and St. Louis Fed nowcasts for Q2 are -35.8%, -51.2%, and -49.75% (SAAR), respectively. IHS Markit is -42.9%.
Geographical Distribution of April Growth – Philadelphia Fed Indexes
From the Philadelphia Fed Coincident Index release today:
No V Recovery: 538.com & IGM COVID-19 Economic Outlook Survey Series
From IGM:
The IGM is administering this new survey on the outlook for the economy in collaboration with fivethirtyeight.com. The FiveThirtyEight/IGM COVID-19 Economic Outlook survey complements the existing IGM expert panels and is being overseen by Professors Allan Timmermann and Jonathan Wright. The list of experts answering the questions is identified in the post along with the responses.
The Elasticity of Mortality with Respect to Recession
I hear a lot about deaths rising with recessions. What does the data indicate about the robustness of such a relationship?
Business Cycle Indicators, May 15th
With industrial production for April released, we have a clearer picture of economic activity in that month. Here are some indicators followed by the NBER’s BCDC.
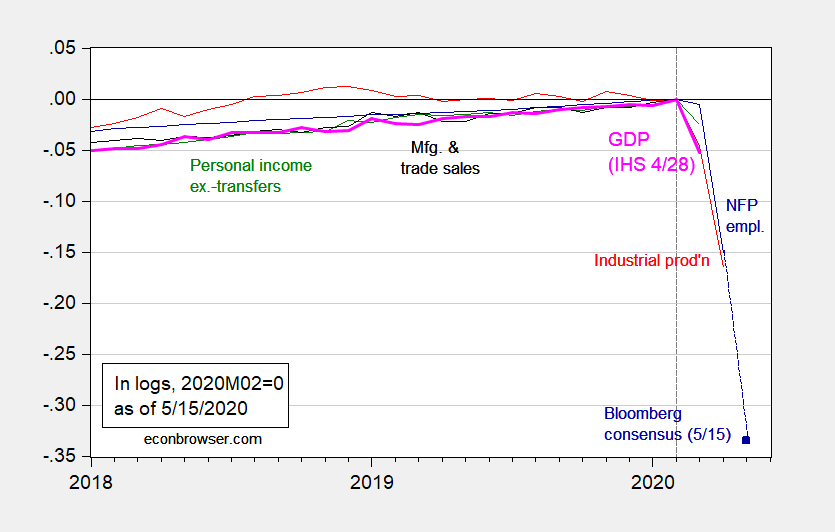
Figure 1: Nonfarm payroll employment (blue), industrial production (red), personal income excluding transfers in Ch.2012$ (green), manufacturing and trade sales in Ch.2012$ (black), and monthly GDP in Ch.2012$ (pink), all log normalized to 2019M02=0. Source: BLS, Federal Reserve, BEA, via FRED, Macroeconomic Advisers (4/28 release), and author’s calculations.