Today, the DWD released statistics for December here. Total nonfarm payroll declined slightly, private increased slightly. The cumulative gap with respect to Minnesota (and the US) widened in both cases.
Continue reading
Category Archives: Wisconsin
Wisconsin in Recession?
I doubt it, but it’s more likely than an ongoing recession in California. Wisconsin year-on-year GDP growth lags, personal income and wages/salaries growth are both bouncing around zero.
Wisconsin Macro Aggregates Stall
Wisconsin real personal income in Q3 is less than it was a 2015Q4, and since 2011Q1, cumulative nominal income is 5% lower than that in Minnesota (and the US). Wisconsin GDP growth through Q2 lags Minnesota and US.

Figure 1: Wisconsin GDP (blue) and personal income deflated by US PCE (red) in mn. Ch.2009$, SAAR, both on log scale. NBER defined recession dates shaded gray. Source: BEA, and author’s calculations.
Wisconsin Output since Implementation of the MAC
The Manufacturing and Agriculture Credit, that is.
Continue reading
Where’s the Wisconsin Manufacturing Output Renaissance?
Employment in manufacturing may be estimated to be rising, but output seems to be trending sideways through 2nd quarter.
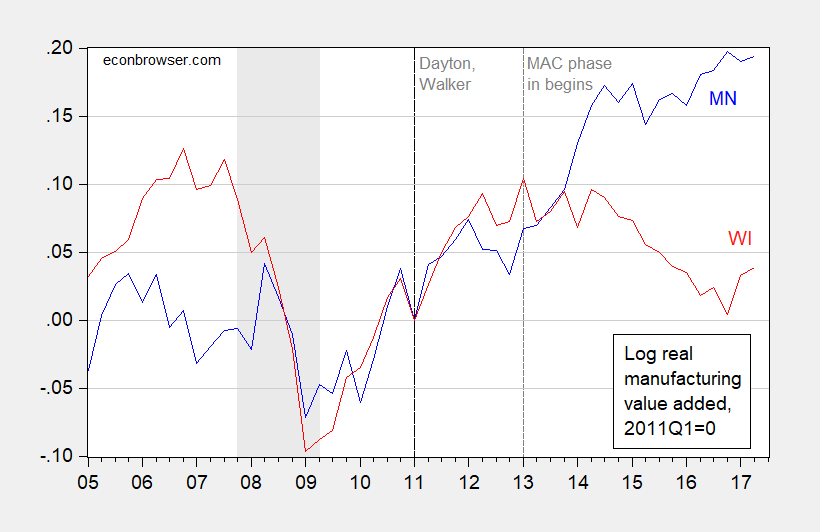
Figure 1: Log real manufacturing output in Minnesota (blue) and in Wisconsin (red), normalized to 2011Q1=0. NBER defined recession dates shaded gray. Vertical dashed line at 2013Q1 indicates beginning of Wisconsin Manufacturing and Agriculture Credit (MAC). Source: BEA, accessed 12/3/2017, NBER, and author’s calculations.
Tracking Wisconsin Manufacturing Employment
The Wisconsin Department of Workforce Development (DWD) today released new employment data for October. Manufacturing employment surged in the establishment data, but the contemporaneously released additional three months of data from the Quarterly Census of Employment and Wages (QCEW) (through June) suggests slower manufacturing growth.
Quarterly Census Data on Wisconsin Manufacturing: More on Premature Triumphalism
Recall the Walker Administration termed the Quarterly Census of Employment and Wages (QCEW) the “gold standard” of employment measures. I thought it useful to compare the QCEW figures on manufacturing against the establishment survey. Here is the twelve month growth rate under the two measures (the QCEW data is not seasonally adjusted).
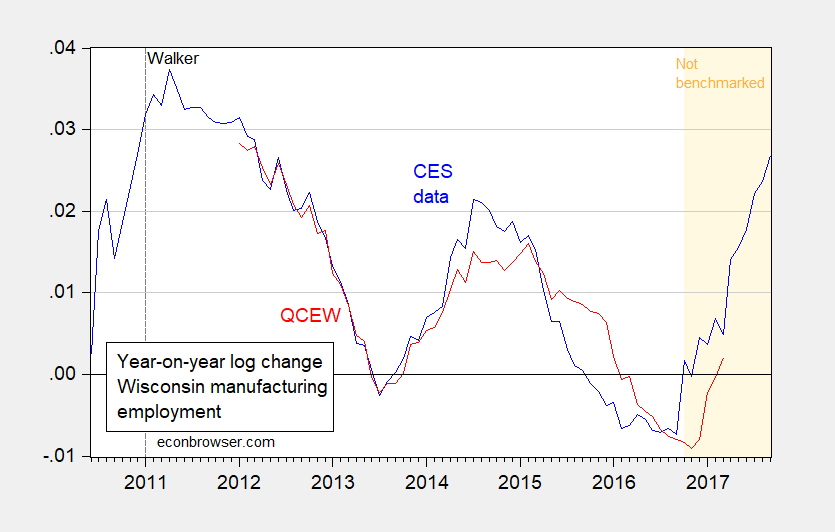
Figure 1: 12 month log difference in Wisconsin manufacturing payroll employment from establishment survey (CES) (blue), and from Quarterly Census of Employment and Wages (QCEW) (red). Light brown shaded area denotes period where CES data has not been benchmarked using QCEW data. Source: BLS, DWD and author’s calculations.
How’s Wisconsin’s Economy Doing?
Employment underperforming the February Budget forecast; output too. Philadelphia Fed indices say activity is flat. A time series forecast using forward-looking indicators implies a continued rise in the unemployment rate.
A Modest Proposal (to Boost Growth): Wisconsin Edition
Certain individuals (even on this weblog) have highlighted the decline in labor force growth as a factor in stagnant economic growth in Wisconsin. Wisconsin State Representative Scott Allen has the following public policy proposal, as recounted in The Hill:
Did Lower Relative Manufacturing Wages Lead to Greater Manufacturing Activity in Wisconsin?
As suggested here. Maybe. It might depend on the measure of economic activity.