Employment in early January continues to decelerate to near standstill (BLS), as I suggested in November would happen if the US did not implement a coherent plan to contain the Covid-19 pandemic.
A Review of Minimum Wage Effects
From Alan Manning, in Journal of Economic Perspectives (a journal of the American Economic Association), “The Elusive Employment Effect of the Minimum Wage”:
The American Rescue Plan Assessed
I talked through some issues regarding the competing recovery plans in this Wisconsin Public Radio interview. Here are some graphs to buttress my point that the Senate Republican plan is underpowered.
CBO’s Outlook and the Output Gap
CBO released its projections for GDP under current law, and potential GDP yesterday.
Flash-mob finance
Modern communication infrastructure can facilitate swift simultaneous action by a large number of people. If used to coordinate a surprise attack, an organized mob can overcome a store or even the capitol building. Is Wall Street the next target?
Continue reading
The Economy at Trump’s End
In recovery (as Jim noted using GDP), but not recovered. And maybe even declining for certain key indicators.
The COVID recession is over
The Bureau of Economic Analysis announced today that seasonally adjusted U.S. real GDP grew at a 4.0% annual rate in the fourth quarter. That’s well above the 3.1% average growth that the U.S. experienced over 1947-2019, and follows a 28.8% logarithmic annual growth rate seen in Q3.
Continue reading
Guest Contribution: “Republicans oppose deficits only when Democrats hold the White House”
Today, we present a guest post written by Jeffrey Frankel, Harpel Professor at Harvard’s Kennedy School of Government, and formerly a member of the White House Council of Economic Advisers. A shorter version appeared at Project Syndicate.
Business Cycle Indicators as of January 26th
New information coming out on Friday, employment in a week and a half. For now:
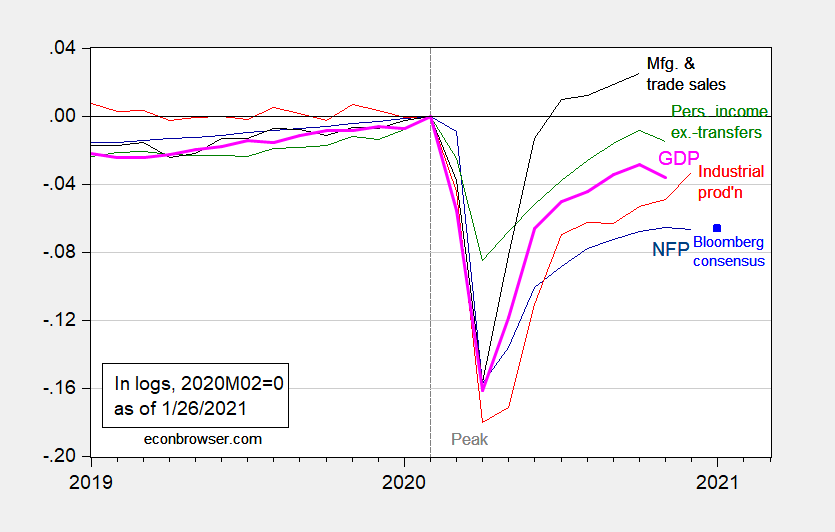
Figure 1: Nonfarm payroll employment (dark blue), Bloomberg consensus for January as of 1/26 (blue square), industrial production (red), personal income excluding transfers in Ch.2012$ (green), manufacturing and trade sales in Ch.2012$ (black), and monthly GDP in Ch.2012$ (pink), all log normalized to 2020M02=0. Source: BLS, Federal Reserve, BEA, via FRED, IHS Markit (nee Macroeconomic Advisers) (1/4/2021 release), NBER, and author’s calculations.
OECD Weekly Tracker of Economic Activity
Real time estimates of GDP based on Google Trends and machine learning for OECD and G-20 countries, here. Here’s the current US GDP nowcast: