Industrial production, personal income ex-transfers, and Macroeconomic Advisers’ monthly GDP are all below recent peak; manufacturing and trade industry sales and nonfarm payroll employment are still rising (although barely, in the latter case). Here’s a graph of these five indicators.
“Trump revs up his Wayback Machine”
From Ben White in Politico today:
President Donald Trump is firing up his economic Wayback Machine in an effort to boost markets, the economy and his own political fortunes heading into his reelection campaign.
Economists warn that Trump’s approach, with its roots in 19th century mercantilism and 1980s Reaganism, risks back-firing on him in potentially significant ways.
Winning ™ – Soybeans Front
Keep on saying that we’re winning, and maybe it’ll come true. For the rest of us grounded in reality, soybean prices are falling again, and soybean stocks are rising (and estimates of end FYMY2018/2019 stocks have just been revised upward).
Soybeans: Efficient Markets Hypothesis and All That Jazz
Reader CoRev continues to voice skepticism about the predictive ability of soybean futures. He asks for
proof, with successful predictions, of the validity of…your soybean price model….BTW, we are getting closer to the model’s magic validation date.
“Seattle’s Chinese American veterans to receive long overdue honor from U.S.”
I saw this Seattle Times article while visiting my hometown, and it struck me as relevant, as the Trump administration is now deporting veterans, willy nilly. From the article.
When the [Second World] war began, the United States government had not yet repealed the Chinese Exclusion Act of 1882, the nation’s first immigration ban on a specific ethnic group. The law severely limited Chinese immigrants from entering the country and becoming naturalized citizens for more than 60 years, until the end of 1943.
This meant that while up to 20,000 Chinese Americans served in the military during World War II, about 40% were not even granted citizenship, according to the Chinese-American World War II Veteran Congressional Gold Medal Act.
Guest Contribution: “Tenth birthday of the June 2009 recovery “
Today, we present a guest post written by Jeffrey Frankel, Harpel Professor at Harvard’s Kennedy School of Government, and formerly a member of the White House Council of Economic Advisers. A shorter version appeared in Project Syndicate on June 14th, and in The Guardian.
Down, Down, Down: 10 Year Yields in Advanced Countries
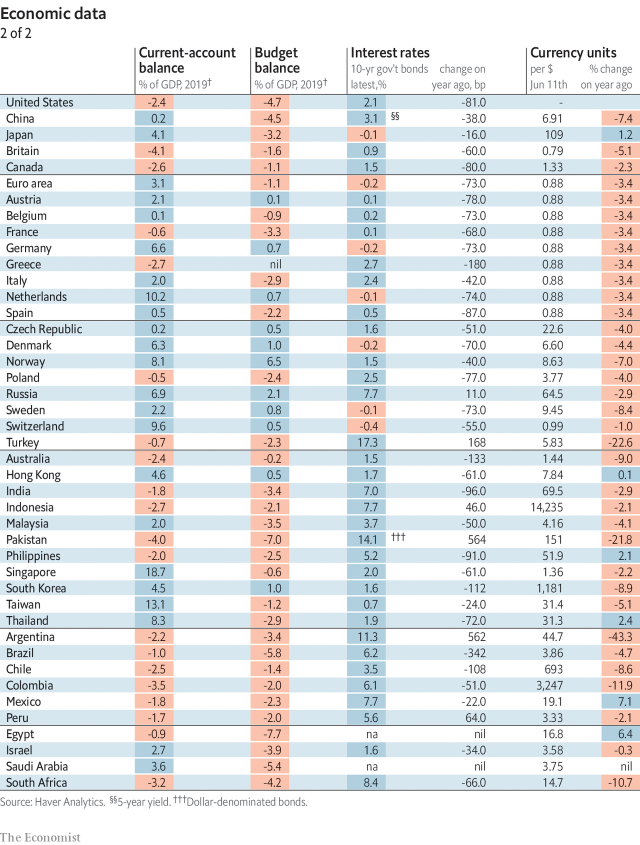
Perusing the last issue of the Economist, I noted that among advanced economies, only Greece (180 bps), Spain (87 bps), Australia (133 bps), South Korea (112 bps) and Chile (108 bps) had larger declines in the ten year yields than the US (81 bps).
Of these, one could argue Greece and Spain declines were attributable to a decline in default risk, leaving only Australia, South Korea and Chile.
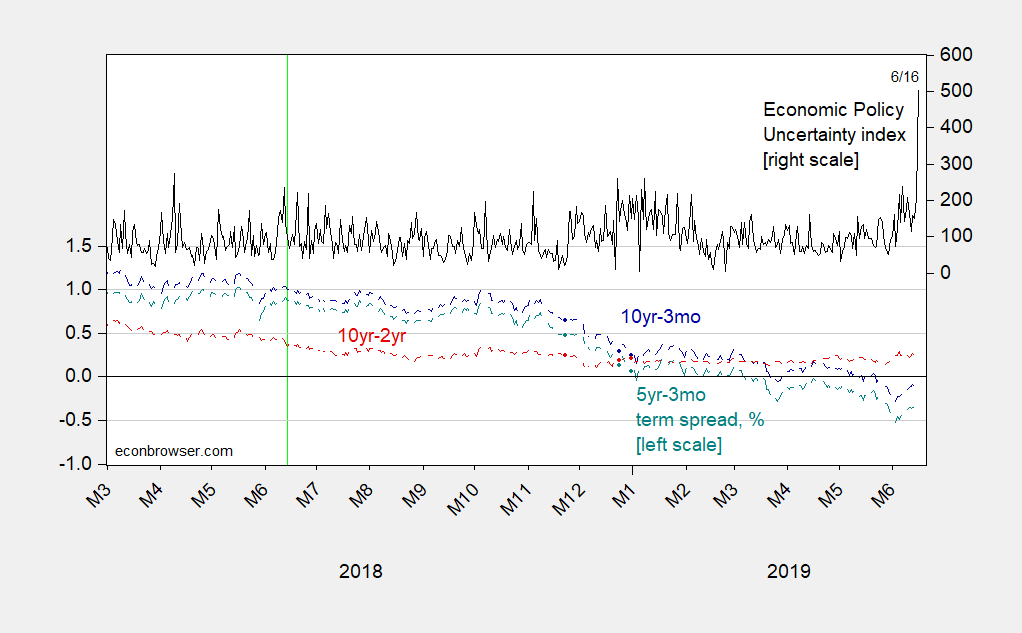
Figure 1 below illustrates what has happened to 10yr-3mo, 10yr-2yr and 5yr-3mo spreads over the past year (indicated by vertical green line)
Guest Contribution: “Remembering Martin Feldstein”
Today, we present a guest post written by Jeffrey Frankel, Harpel Professor at Harvard’s Kennedy School of Government, and formerly a member of the White House Council of Economic Advisers.
“[L]et’s have Bretton Woods again.” Arthur Laffer 1982
And maybe other folks, up for the Fed? Well, Judy Shelton says gold might be the way to go…
That’s from an interview Erik Brynjolffson, Tod Loofbourrow and I conducted back in 1982 for the Harvard International Review. So, if Obama’s November 2008 election could’ve caused the Great Recession that started in December 2007 (and the Lehman Brothers collapse in September of 2008) as Laffer has claimed, why not Bretton Woods redux?
Guest Contribution: “A Tale of Two Surplus Countries: China and Germany”
Today we are fortunate to present a guest contribution written by Yin-Wong Cheung (City University of Hong Kong), Sven Steinkamp (Universität Osnabrück) and Frank Westermann (Universität Osnabrück). This contribution is based on a paper forthcoming in the Open Economies Review.

