Question: Shouldn’t we be doing a lot better than Italy and Spain? Could we have implemented a system of social-distancing combined with testing and tracking that would not have entailed an economic shutdown of the current magnitude (i.e., could we have implemented something closer to what S. Korea did, had we had a competent administration and leader not-in-denial?).
When Non-Specialists Predict Outside of Their Expertise
A reader, Ed Hanson, critiques the flagging of the fact that there were three waves of the 1918-20 flu:
You may not be a fortune teller, but you do tend toward being a panic monger.
Case in point, never knew that the Spanish flu was coronavirus. Maybe, that is because it is not.
While not being a doctor, a little research shows that there have been 7 identified coronaviruses causing human disease. 4 associated with the common cold, and 3 known for acute respiratory syndrome. These being MERS, SARS, and the covid-19.
OF the first 6, none shows the the wax and wane you write of in the topic.
That leaves covid-19. certainly the most deadly of the 7. I would rate a Spanish flu like wax and wane, far down as a possibility but still possible. More likely it won’t because the other coronoviruses have not shown that tendency.
Now Mr. Hanson is merely a random commenter; I quote him because he is representative of a group of individuals who are happy to predict with apparently no expertise, and without any apparent reference to mainstream scientific analysis. So, from The Hill:
A potential second wave of the novel coronavirus late in the year would likely be more deadly, as it would overlap with flu season, Centers for Disease Control and Prevention (CDC) head Robert Redfield told The Washington Post on Tuesday.
“There’s a possibility that the assault of the virus on our nation next winter will actually be even more difficult than the one we just went through,” Redfield told the Post. “And when I’ve said this to others, they kind of put their head back, they don’t understand what I mean.”
Mr. Trump has tried to whitewash the statement; from WaPo today:
In a tweet Wednesday, Trump alleged Redfield had been misquoted. But he accused CNN of having done so, even though CNN merely relayed the comments published by The Post.
“CDC Director was totally misquoted by Fake News @CNN on Covid 19,” Trump said. “He will be putting out a statement.”
In yesterday’s press conference, he indicated he’d been correctly quoted by WaPo.
Negative oil prices
First negative interest rates, and now negative oil prices. Is the world coming to an end?
Continue reading
From 2010, Some Economists on the Conduct of Large Scale Asset Purchases
Courtesy of Hoover Institution:
Benefit Cost Analysis with Steve “Kansas is doing just fine” Moore
From ABC News yesterday:
“I think we lean way too much in the direction of keeping the economy shut down to try to save every life, not realizing that we’re causing huge hardship for citizens — again, people at the bottom and businesses — and we’re going to suffer a big loss of living standards because of this,” he said.
While Moore acknowledged that robust testing is essential, he argued the U.S. cannot wait until it becomes more widespread to start reopening the economy.
“I don’t think we can wait two or three or four more weeks for testing….The rate of infection to the economy is very similar to the rate of infection of this disease.”
Guest Contribution: “Business cycle dynamics after the Great Recession: An Extended Markov-Switching Dynamic Factor Model “
Today, we’re pleased to present a guest contribution written by Catherine Doz (Paris School of Economics), Laurent Ferrara (SKEMA Business School and International Institute of Forecasters) and Pierre-Alain Pionnier. The views presented represent those of the authors, and not necessarily those of the institutions the authors are affilliated with.
First Virtual IIF Workshop on “Economic Forecasting in Times of Covid-19”
Call For Papers
July 6-7, 2020
The COVID-19 pandemic has triggered a massive spike in concerns and uncertainties and raised challenges in macroeconomic forecasting surrounding almost every aspect. The purpose of this virtual workshop is to bring together researchers working on various aspects of measurement, modelling, evaluation and forecasting of COVID and its impact on the economy.
Some Business Cycle Indicators, April 15th
Here are some key indicators followed by the NBER’s BCDC as of today:
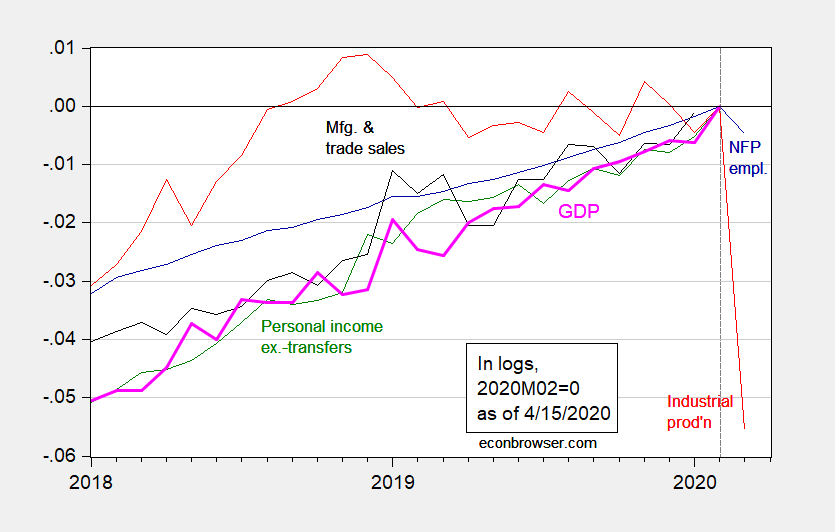
Figure 1: Nonfarm payroll employment (blue), industrial production (red), personal income excluding transfers in Ch.2012$ (green), manufacturing and trade sales in Ch.2012$ (black), and monthly GDP in Ch.2012$ (pink), all log normalized to 2019M01=0. Manufacturing and trade sales for February assumed to be at stochastic trend for 2018-2020M01. Source: BLS, Federal Reserve, BEA, via FRED, Macroeconomic Advisers (3/26 release), and author’s calculations.
Guest Contribution: “Will the Recovery be J-Shaped?”
Today, we are pleased to present a guest contribution written by David Papell and Ruxandra Prodan, both of the Department of Economics at the University of Houston.
Some Forecasts
It’s been interesting to me to see how various economic groups assess the outlook. Here are a select few:
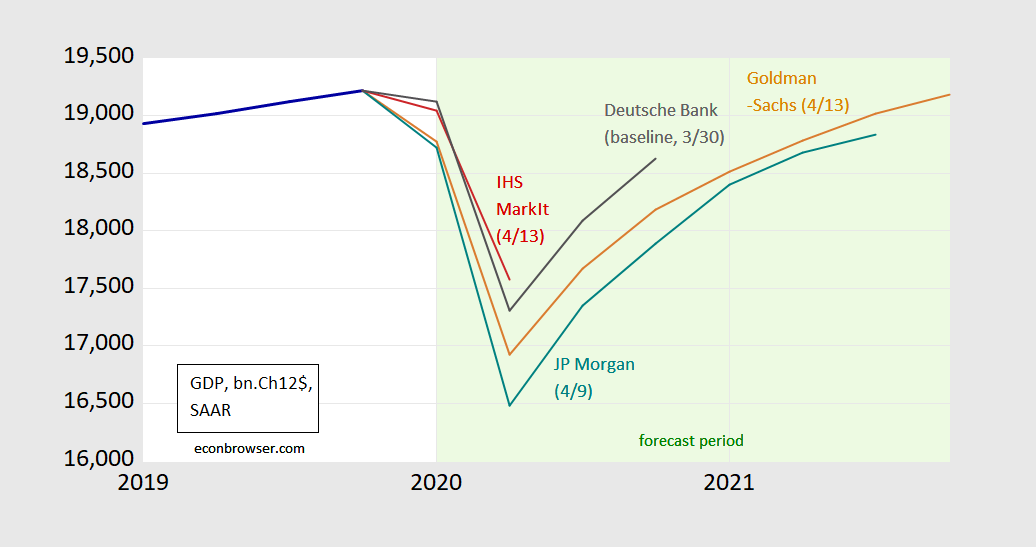
While rapid growth is projected for the end of the year, it’s of interest to note that output will still be below the pre-Covid19 trajectory.
It must be an unenviable task to forecast output in these times. Thinking about it a bit, on top of the usual challenges, these forecasts have to be conditioned on big question marks (so known unknowns as well and unknown unknowns).
- Scientific unknowns about degree of contagiousness, whether there’s seasonality, the ease of reinfection
- Political unknowns such as commitment to developing an infrastructure to test, track the epidemic, so that the economy can be restarted without large increments to fatalities.
- Unknowns regarding how the health infrastructure has been degraded by the scattershot administrative response, thereby constraining the readiness for restart
- Unknowns regarding administrative capacity of a Federal government that has many policy level positions still vacant.
Update, 4/21:
A Vox article on the difficulties of forecasting, even w/o a pandemic, here.