Take a look at what exports to China will look like, with an additional $200 bn exports to China over two years, using the 2017 levels, as reported:
Navarro vs. Navarro
From WSJ today, an op-ed by Peter Navarro:
The national-security externalities associated with Trump trade policy may be even more consequential. A case in point is the tariffs being used as leverage to defend America’s technological crown jewels from being forcibly transferred to Chinese companies—from artificial intelligence, robotics and autonomous vehicles to quantum computing and blockchain. These industries comprise the core of the next generation of weapons systems needed to repel threats from rivals like China, Russia and Iran. One must ask the antitariff forecasters: Where are the benefits of a freer and more secure American homeland counted in your models?
From Peter Navarro, The Policy Game (Wiley, 1984), p.82, on the national security/trade policy nexus.
National Security Benefits and Costs. On the benefit side, protectionism within certain basic industries like autos, steel, and electronics helps to create and sustain and industrial base that, in times of war or national peril, can be shifted to defense purposes. However, this national security argument–and the existence of any benefits resulting from protecting these industries–can legitimately be called into question for several reasons.
First, the existence of any sizable benefits rests on the assumptions that import competition in our defense-related industries would not only reduce the size of these industries but also shrink them to the point where they would be too small to support our defense needs…
Second, it is highly possible that our defense capability might actually be enhanced–not damaged-by import competition. Without the umbrella of protectionism, our defense-related industries would be forced to operate at lowest cost, engage in more research and development, aggressively innovate to stay one step ahead of the competition, and modernize their plants at a faster pace. …
On the national security cost side, the major effect of protectionism is to threaten the stability of the international economic order through a global trade war. …
Full disclosure: I worked as a research assistant on this book.
Update, 1/15:
A picture of steel production and employment; Section 232 period shaded orange.
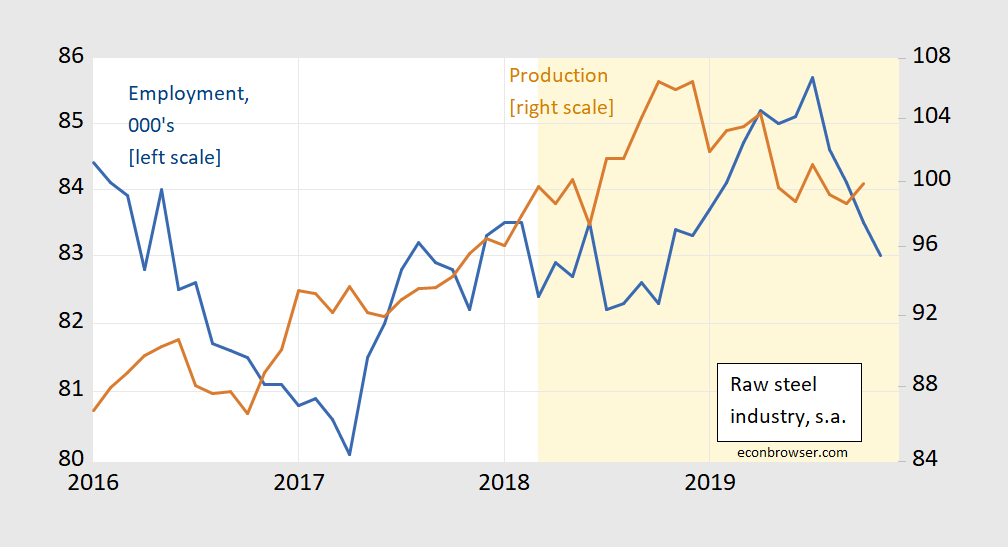
Figure 1: Employment in raw steel production (blue, left log scale), and industrial production (brown, right log scale). Light orange shading denotes Section 232 announcement and thereafter. Source: BLS, and Federal Reserve Board via FRED.
On the Eve of “The Deal – Phase 1” Signing
Currency manipulation or not? The Treasury’s semiannual foreign exchange report, released yesterday, says no, contra Mr. Trump’s statement a few months ago.
Is Employment Growth (a Lot) Lower Than We Think?
Yesterday’s employment release indicated a deceleration in nonfarm payroll (NFP) employment growth. Data from other sources suggests that the deceleration over the last year is more marked than indicated by the establishment survey.
Wisconsin, Minnesota and US GDP over the Walker Years
State level GDP data for 2019Q3 are out today. If you were wondering, Wisconsin lagged both the US and Minnesota. Since 18Q4 (the last full Walker quarter), Wisconsin growth has matched Minnesota growth.
Required Reading on the History of (Macro)economic Thought
Why was the financial crisis of 2008 so surprising to so many macroeconomists (but from my experience, a little less so for international finance economists familiar with financial crises in emerging markets…)? From the conclusion to George Akerlof’s “What They Were Thinking Then: The Consequences for Macroeconomics during the Past 60 Years” in the latest JEP.
Shouldn’t we win the trade war before beginning a shooting war?
From ASSA, take a look at the first paper’s abstract:
United States-China Trade Relationships
Hosted By: CHINESE ECONOMIC ASSOCIATION IN NORTH AMERICA
- Chair: Heiwai Tang, Johns Hopkins University and Hong Kong University
“Most important global event of 2020? The US election”
Today, we present a guest post written by Jeffrey Frankel, Harpel Professor at Harvard’s Kennedy School of Government, and formerly a member of the White House Council of Economic Advisers.
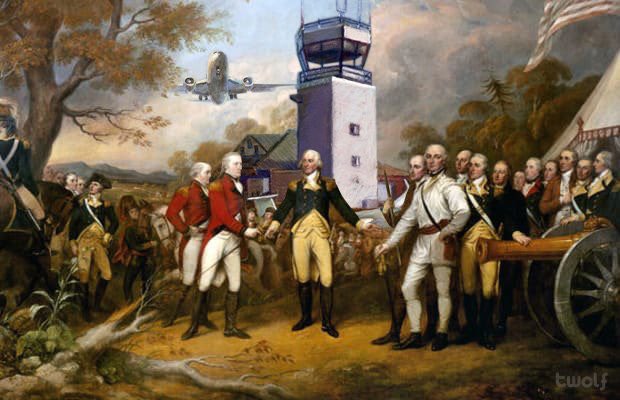
Year in Review, 2019: “Victory at IAD” and Other Alternative Facts
It’s the year that Donald Trump said that in the war against Great Britain, “Our army manned the air, it rammed the ramparts, it took over the airports, it did everything it had to do, and at Fort McHenry, under the rockets’ red glare, it had nothing but victory.”
Business Cycle Indicators, End-2019
Here are some key indicators tracked by NBER’s Business Cycle Dating Committee:
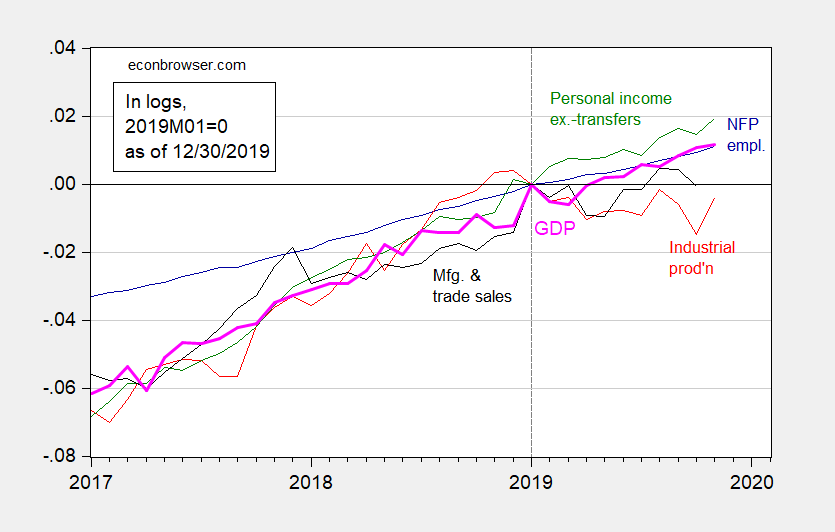
Figure 1: Nonfarm payroll employment (blue), industrial production (red), personal income excluding transfers in Ch.2012$ (green), manufacturing and trade sales in Ch.2012$ (black), and monthly GDP in Ch.2012$ (pink), all log normalized to 2019M01=0. Source: BLS, Federal Reserve, BEA, via FRED, Macroeconomic Advisers (12/30 release), and author’s calculations.