Using today’s state level GDP release, we can assess how highly ranked states like Kansas performed subsequently, as compared to poorly ranked states like California.
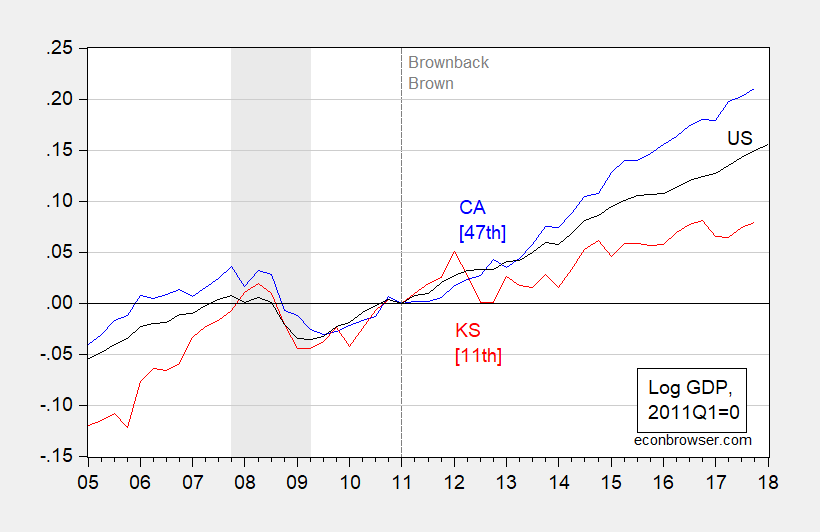
Figure 1: Log California real GDP (blue), Kansas (red), and US (black), normalized to 2011Q1=0. NBER defined recession dates shaded gray. [##] denote Rich States, Poor States 2013 Economic Outlook rankings for 2013 (based on 2012 data). Source: BEA, May 2018, NBER, ALEC, and author’s calculations.