That’s the title of a forthcoming special section in the Journal of International Money and Finance. Here’s the introductory article to the special issue [link].
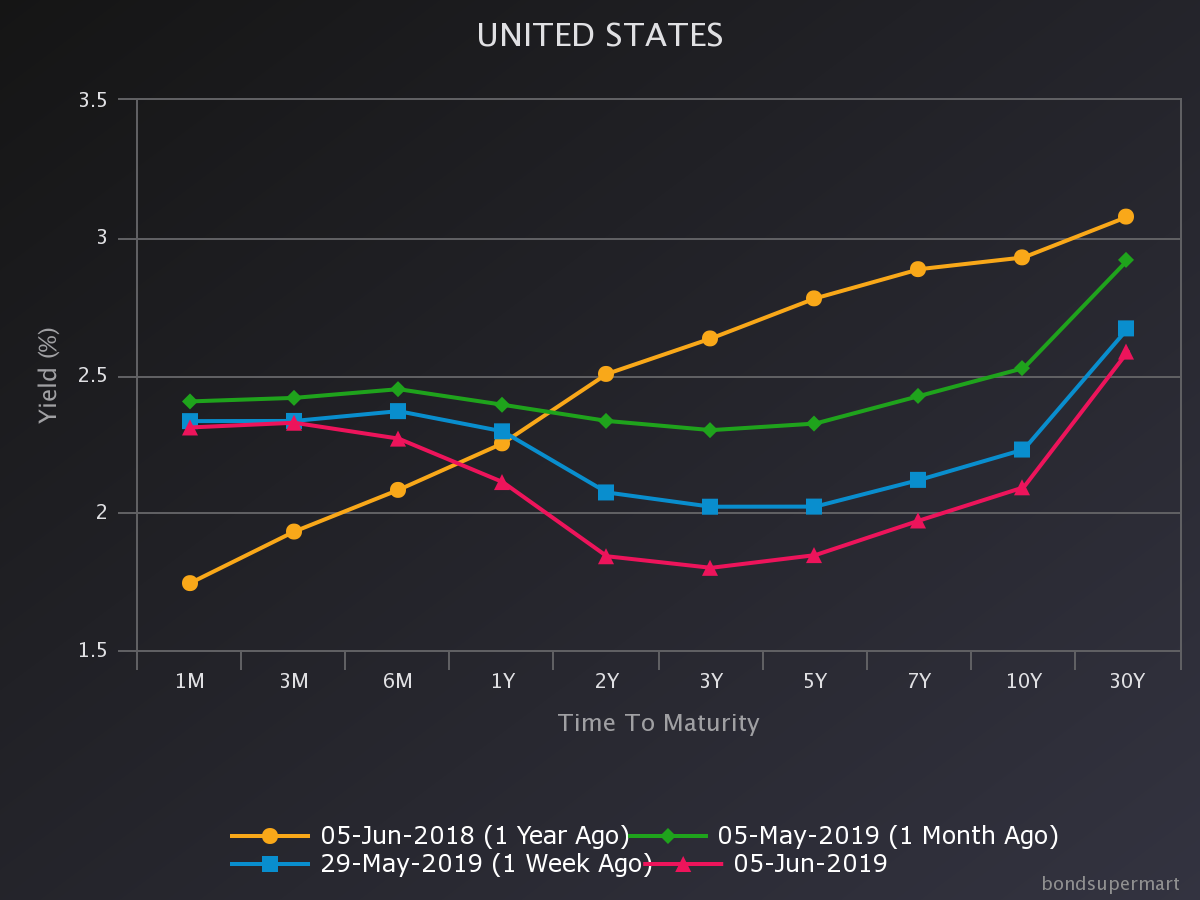
Disruptions to financial markets, elevated risk levels, and unconventional monetary policies pursued by central banks have altered the landscape of international finance. The near zero and negative interest rates in several key advanced economies, for instance, present a new environment for pricing financial assets and shock transmission. The ultra-accommodative policy stance has affected exchange rates via, for instance, its effects on expectations, capital flows and global liquidity. As a result, new challenges in modelling equilibrium exchange rates, assessing exchange rate misalignment, and evaluating their roles in re-balancing external imbalances, and shock transmission have arisen. Against this backdrop, a conference was convened to provide a platform for discussing recent advances in modelling exchange rates, from perspectives of both major and emerging market currencies. This special issue of the Journal of International Money and Finance consists of eight papers presented at a conference organized by Global Research Unit at Department of Economics and Finance, City University of Hong Kong, Bank for International Settlements, Asian Office, and Centre for Economic Policy Research, with advice from Nelson Mark, and held at City University of Hong Kong, May 18–19, 2017. The topics covered advances in empirical exchange rate modeling, the effect of news, risk and uncertainty on currency values, order flow and exchange rates, monetary policy and interest rate parity, and the behavior of the Renminbi duringthe post-crisis. We describe below the main take-aways from these papers. …
The entire article is here (ungated for 50 days). special issue [link]. Published online: Adler, Lama & Medina, Berg & Mark, Cao, Huang, Liu & MacDonald, Cheung, Chinn, Garcia Pascual & Zhang (ungated for 50 days), Cheung, Fatum & Yamamoto, Engel, Lee, Liu, Liu & Wu, Krohn & Moore, and McCauley & Shu.
Continue reading →