Today, we present a guest post written by Jeffrey Frankel, Harpel Professor at Harvard’s Kennedy School of Government, and formerly a member of the White House Council of Economic Advisers. A shorter version appeared on December 22nd in Project Syndicate.
Trends in Kansas GDP
Both Missouri and BEA Plains region (ex-Kansas) outpace Kansas GDP growth.
A 10% Across-the-Board Tariff?
Today the idea of a 10% across-the-board tariff rate increase was mooted. As Noland et al. (2016), pp.9-10 observe, the President has authority to undertake such measures. However, as a member of the WTO, other members have a right to dispute. More likely, they’ll retaliate.
Trade Policy with China
Since President-elect Trump has nominated Peter Navarro* to direct the newly formed Trade Policy Council, now seems a good time to review some trade data.
Post-Brexit Out-of-Sample Forecasted Electricity Consumption
Take England+Wales log daily electricity consumption, detrend using Christiano-Fitzgerald band pass filter, and then regress on seasonal (calendar) terms, and temperature/wind/rain factors (Kirchmaier and de Guana de Santiago, 2016, h/t Simon Kennedy at Bloomberg), through April 2016. Then forecast out of sample; the residual looks like this:
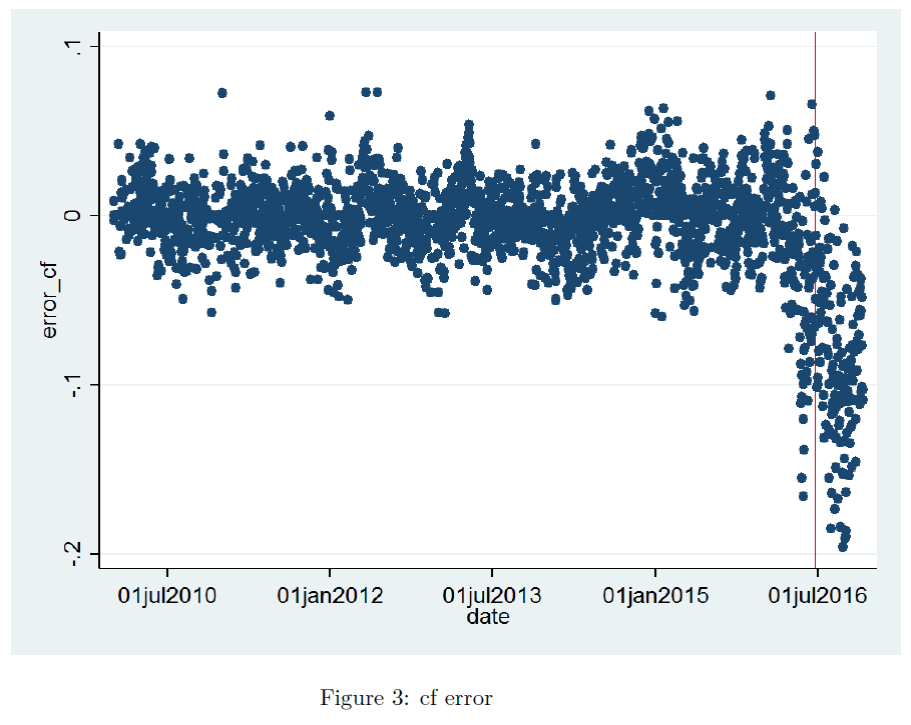
Figure 3 from Kirchmaier and de Guana de Santiago, (2016).
Electricity consumption is way under what would be expected from historical correlations, suggesting a decline in economic — particularly industrial — activity.
While monthly estimates of November GDP are up 1.1% relative to June, industrial output is down by 1.2%, according to NIESR (Dec. 7).
It is always useful to keep in mind that economic statistics are sometimes revised by large amounts.
Guest Contribution: “Five Key Factors for 2017”
Today, we present a guest post written by Jeffrey Frankel, Harpel Professor at Harvard’s Kennedy School of Government, and formerly a member of the White House Council of Economic Advisers.
Back to normal?
A year ago, the Federal Reserve decided to raise its target for the fed funds rate by 25 basis points above the floor of 0-0.25% at which we’d been stuck for 7 years. FOMC members indicated at the time that they were expecting to end 2016 at 1.4%, or four rate hikes during the last year. We started this December at 0.41%, and the first hike of 2016 didn’t come until last week. Now FOMC members say they are expecting to end 2017 at 1.4%, or three more hikes from here during the next year. The January 2018 fed funds futures contract is currently priced at 1.23%, suggesting that the market is buying into two, not three hikes during 2017.
Continue reading
Sound and Fury Signifying…? Mulvaney to OMB
A Big MacParity Guide to Undervalued Currencies
China is not high on the list for “day one sanctions” if one were to look at this fast-food data.
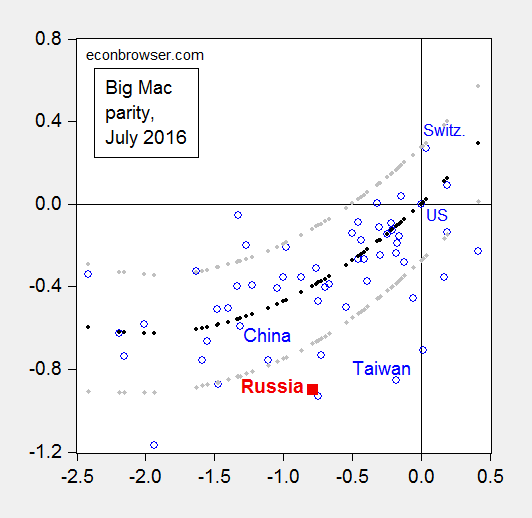
Figure 1: Log relative dollar price of Big Mac against dollar price of US Big Mac (July 2016) versus log relative per capita income in PPP terms (2016 estimates); regression fit from quadratic specification (black dots), and 90% prediction interval (gray dots). Source: Economist, World Bank World Development Indicators, and author’s calculations. Data [XLSX]
Using the methodology outlined in this post, it’s clear that by the price criterion, Russia’s currency is much more undervalued (at 50% in log terms) than China’s.
Kansas Employment Decline Continues
Missouri employment rises.