Jason Furman points us out to his favorite Table 8-2 in the Economic Report of the President, 2018, released yesterday, with particular reference to the productivity assumption.
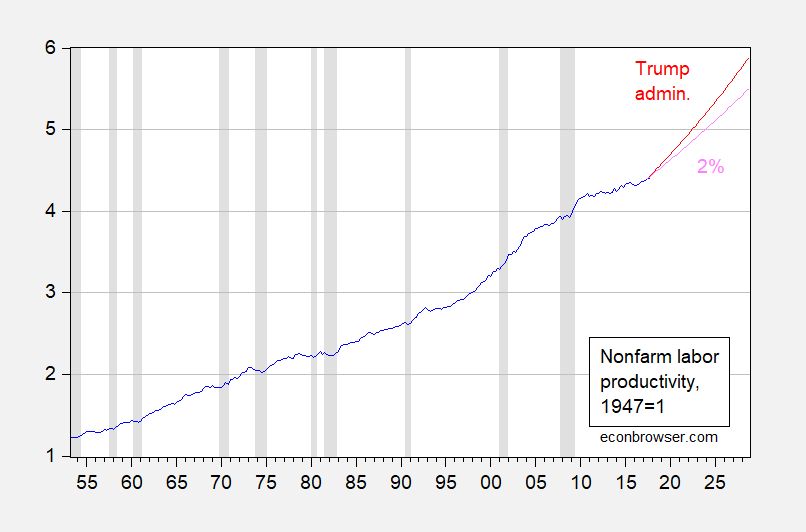
Figure 1: Nonfarm real output per hour, 1947Q1=1 (blue), Trump Administration forecast of 2.6% (red), historical average (1953Q2-2017Q3) growth rate of 2% (pink). NBER defined recession dates shaded gray. Source: BLS via FRED, NBER, CEA and author’s calculations.