A recent study by Luciana Juvenal and Ivan Petrella suggests that the financialization of oil futures markets contributed significantly to the surge in oil prices after 2003. Lutz Kilian, Professor of Economics at the University of Michigan, questions their analysis and highlights that their paper actually does not shed any light on the role of Wall Street speculation.
Crowding Out Watch: July 2012
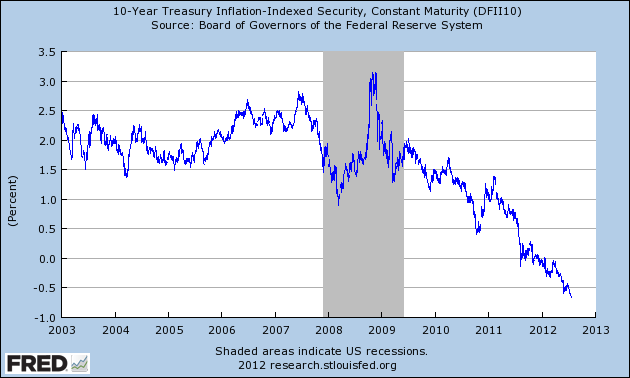
As feared by Representative Ryan, in March 2011, crowding out due to deficits: The ten year inflation adjusted constant maturity rate as of 7/20 was -0.67%

Source: St. Louis Fed FRED accessed 7/24 11am Pacific.
The Path Not Taken … Thus Far: Debt Deleveraging by Inflation
From the latest issue of the Milken Institute Review, “Trends: Better Living Through Inflation” (co-authored with Jeffry Frieden):
The fiscal cliff and rationality
What should happen, what could happen, and what will happen?
Wisconsin Employment Release for June: Payroll, Private, Civilian Employment Decline.
The BLS has released preliminary estimates for June employment in Wisconsin. Private payrolls declined 11.7 thousand while total nonfarm payroll declined 13.2 thousand (0.5% and 0.5% respectively, using log differences), at seasonally adjusted rates. Civilian employment decreased 7.9 thousand (0.3%). (At annualized rates, these would be 6%, 5.8% and 3.3%, respectively). It is interesting to observe that none of these figures are cited in the text of the Wisconsin Department of Workforce Development press release. Instead, it notes:
Would Regulation of Libor Have Passed Senator Shelby’s Benefit-Cost Analysis?
Senator Shelby, Ranking Republican of the Banking Committee, has sponsored The Financial Regulatory Responsibility Act, which seeks to restrict implementation of Dodd-Frank, and require benefit-cost analysis for financial regulation. To quote Sen. Shelby: “American job creators are under siege from the Dodd-Frank Act.” [1] Now, it’s clear that British authorities have primary responsibility for regulating Libor (after all, the “L” in Libor stands for “London”). But I think it’s useful to consider this question because clearly similar concerns will arise in markets in the US sometime in the future.
Maugeri on peak oil
Carpe Diem, Reuters, FTalphaville, and WhaleOil are among those calling attention to a new paper by Leonardo Maugeri, senior manager for the Italian oil company Eni, and Senior Fellow at Harvard University, which concluded:
Contrary to what most people believe, oil supply capacity is growing worldwide at such an unprecedented level that it might outpace consumption. This could lead to a glut of overproduction and a steep dip in oil prices.
Based on original, bottom-up, field-by-field analysis of most oil exploration and development projects in the world, this paper suggests that an unrestricted, additional production (the level of production targeted by each single project, according to its schedule, unadjusted for risk) of more than 49 million barrels per day of oil (crude oil and natural gas liquids, or NGLs) is targeted for 2020, the equivalent of more than half the current world production capacity of 93 mbd. [After factoring in risk factors and depletion rates of currently producing oilfields], the net additional production capacity by 2020 could be 17.6 mbd, yielding a world oil production capacity of 110.6 mbd by that date.
Here I take a look at some of the details of Maugeri’s analysis.
High Inflation at the Gates?
The Federal Reserve needs to raise interest rates to stave off inflation, says Rep. Paul Ryan, R-Wis. “I’m worried they’re not going to pre-empt inflation,” the House Budget Committee Chairman tells CNBC.
…
Whither China?
Recent economic reports from China are, at the least, mixed. The responses to Friday’s GDP report are illustrative.
Is QE3 coming?
Conditions have changed since January, and we might expect some additional stimulus from the Fed at the next FOMC meeting.