The Shoveling Must Continue
Bill Beach has retired, and the Heritage Foundation no longer “scores” budget plans. Yet there is still so much … stuff … out there to debunk. Without further ado, here are my top ten examples of delusion in 2013.
1. January. Governor Walker compares Wisconsin to Minnesota, apparently without checking the data (who needs that anyway!). From Dispatches XXIV: Please Proceed Governor (Walker):
There has been something of a dispute between Governor Walker and Governor Dayton of Minnesota. From Minnesota Public Radio, Governor Walker’s tweet, in response to Governor Dayton’s speech:
“In ’11, IL raised taxes on income by 66% & businesses by 46%. Now MN Gov is proposing a $2 bil tax increase. WI is Open for Business.”
We can examine the relative performance of Minnesota and Wisconsin under the differing taxation and spending regimes by reference to the Philadelphia Fed’s coincident indices.
Figure 1: Log coincident indices for WI (blue), MN (red) and US (black), normalized to 2007M12=0. NBER defined recession dates shaded gray. Source: Philadelphia Fed, NBER, and author’s calculations.
One of these is not like the others.
More recent data here on economic activity and employment. The story does not change: Wisconsin continues to lag.
In order to achieve Governor Walker’s target of 250,000 new jobs by January 2015, the Wisconsin economy will need to generate approximately 11,143 new jobs per month, December 2013 onward. Mean job creation over the 1990-2013 sample period is 1,718, with a standard deviation of 5,765. The requisite path is shown in Figure 2.
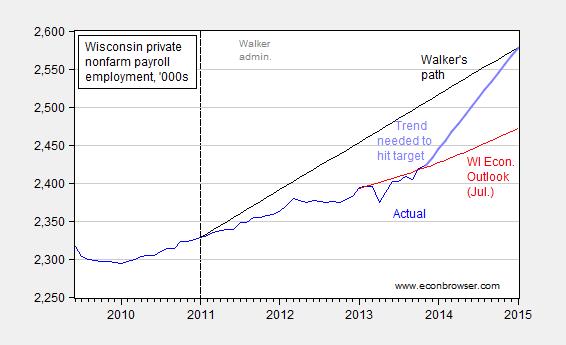
Figure 2: Private nonfarm payroll employment for Wisconsin, seasonally adjusted (blue), July 2013 Wisconsin Economic Outlook forecast, interpolated from annual data using quadratic match (red), Walker’s promised path for private NFP (black), and path from November 2013 required to hit January 2015 target (bold light blue). Source: BLS, Wisconsin Economic Outlook, and author’s calculations.
2. The Heritage Foundation channels Jean-Baptiste Say. From Heritage Still at the Cutting Edge:
From J.D. Foster, Ph.D., “Budget Cuts Would Not Harm the Economy” (February 14, 2013):
The [basic Keynesian] theory fails because it relies on the unstated fantasy government can magically create demand out of thin air. In fact, government must borrow to finance deficits, and all borrowing subtracts from the funds that would otherwise be available and used in the private sector for private investment or private consumption. …
…While budget deficits most certainly increase demand, the borrowing necessary to finance those deficits must dollar-for-dollar reduce demand. The net effect is more government debt but not more total demand and certainly not more jobs.
Those seeking to sustain the theory sometimes point to the possibility of importing more saving from abroad, thus avoiding the reduction in domestic private demand that must otherwise follow from the increase in government borrowing. To be sure, a net increase in imports of foreign saving likely financed some of the recent increase in budget deficits. However, it is also true the balance of payments must balance everywhere and always. As government borrowing rises and net inflows of foreign savings rise, so too must the net trade deficit—either U.S. exports must decline or U.S. imports must rise. In either event, once again total demand is unaffected though the composition of demand changes.Recently, the Heritage Foundation has criticized me for caricaturizing their methodology, and insisting that they use modern, intertemporal approaches. This may very well be true, but thus far, I have not seen much evidence of this modern, intertemporal, approach in Heritage analyses.
3. March: In what reality are we in a recession? From ECRI’s Lakshman Achuthan: U.S. recession began around the middle of last year:
I’m dubious, but I will not “pull a Lazear”. Or a Don Luskin for that matter.
Video here. Some text here. I thought it of use, then, to plot seven of the ten series the NBER Business Cycle Dating Committee (BCDC) uses to date peaks and troughs (these are the ones available to me).
Figure 1: Log personal income excluding transfers (Ch.05$) (blue), log manufacturing and trade sales (Ch.05$) (red), log industrial production (purple), and log nonfarm payroll employment (green), all normalized to 2009M06=0. Dashed line at 2012M06. Gray shaded area denotes NBER recession dates. Sources: BEA (income, sales), Federal Reserve Board (industrial production), BLS (employment), NBER, and author’s calculations.
Figure 2: Log nonfarm payroll employment (green), log aggregate weekly hours (dark blue), and log civilian employment (violet), all normalized to 2009M06=0. Dashed line at 2012M06. Gray shaded area denotes NBER recession dates. Sources: BLS, NBER, and author’s calculations.
For comparison, I include the latest GDP estimates from BEA (2nd release), as well as from Macroeconomic Advisers (used by NBER BCDC) and e-forecasting.
Figure 3: GDP in Ch.05$, SAAR, from BEA (blue bars), from e-forecasting (2/26 release) (red line), and from Macroeconomic Advisers (2/14 release) (green line). Dashed line at 2012M06. Gray shaded area denotes NBER recession dates. Sources: BEA, e-forecasting, Macroeconomic Advisers, and NBER.
Obviously, all of these series will be revised [1] [2] [3], so one wouldn’t want to state definitively we are not in a recession – therein lies the path to embarrassment. But the case still has to be made for recession.
I’ve not heard of a retraction by ECRI on their recession call. Since March US GDP has continued to plug along. From Reason for Optimism:
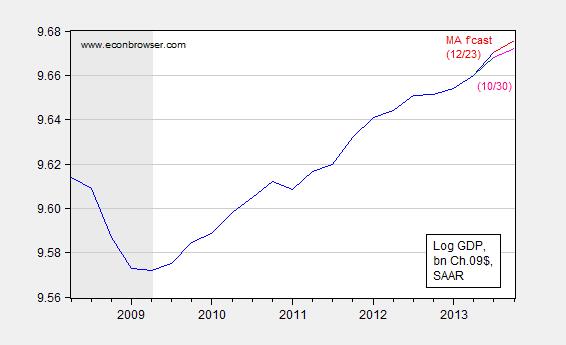
Figure 1: Log GDP, December release (bold blue), October release (dark blue), Macroeconomics Advisers forecast of December 23 (bold red), and forecast of October 30 (pink), all in billions Ch.09$, SAAR. NBER defined recession dates shaded gray. Source: BEA 2013Q3 advance and 3rd release, NBER, and Macroeconomic Advisers.
4. March: Representative Ryan tries to go legit in explaining the economics of his newest plan (no more scoring from Heritage as in here. From Assessing the Economics of the Ryan Plan:
The new House budget proposal has just been released. [0] In the section discussing economic effects, I read the following:
CBO finds that reducing budget deficits, thereby bending the curve on debt levels, is a net positive for economic growth. CBO finds a dichotomy, however, between the short-term and longer-term impacts of deficit reduction. For instance, CBO’s short-term economic models are driven mainly by demand-side factors. According to these short-term models, deficit reduction that lowers government spending leads to a temporary reduction in economic output due to the assumed reduction in consumption as a result of lower government transfers. These models assume government spending has a “fiscal multiplier” in excess of 1, meaning that its reduction leads to an outsized reduction in overall economic output. Of course, every dollar the government spends must be taxed or borrowed from the private sector.
Although CBO believes that deficit reduction may lead to lower economic growth over the short term, some economists offer a contrasting view. They argue that a country’s debt build-up can be so large that longer-term fiscal concerns essentially start to bleed into the present, affecting short-term economic activity. The extreme example is a sudden, full-blown debt crisis like the one that fiscally troubled countries in Europe have experienced. But there is also a less-noticeable, slowly evolving type of crisis that can grip a debt-burdened economy—the crisis of uncertainty and waning confidence in the will of policymakers to deal with the government’s unsustainable fiscal trajectory. Investors and businesses make decisions on a forward-looking basis. They know that today’s large debt levels are simply tomorrow’s tax hikes, interest-rate increases, or inflation—and they act accordingly. It is this House Budget debt overhang, and the uncertainty it generates, that can weigh on growth, investment, and job creation.For instance, Stanford economists John Cogan and John Taylor recently studied fiscal-consolidation strategies that use a so-called “Neo-Keynesian” economic model to take into account how consumers and businesses might react to a country’s future fiscal trajectory. For example, forward-looking consumers and businesses may expect future tax hikes, and plan accordingly, if a country continues to build up large amounts of debt that will ultimately need to be paid off. In this study, Cogan, Taylor, and their fellow authors find that “even in the short-run, the consolidation of government finances is found to boost economic activity in the private sector sufficiently to overcome the reduction in government spending.”66
Some observations:
- No reference to Heritage CDA analysis of the plan, as opposed to the version two years ago. For entertainment, see [1] [2] [3] [4]
- Reference to a “Neo Keynesian” model. Not sure what that is, although this is what Wikipedia says. I think Representative Ryan means to refer to a “New Keynesian” model.
- Footnote 66 refers to the “Fiscal Consolidation Strategy”. The authors use a New Keynesian DSGE to simulate out the implications of fiscal consolidation cited in the plan. I can’t claim to have carefully read the entire paper, but I can’t figure out what is assumed for monetary policy – which is somewhat important if one is considering the short run impact as well as the long run effect (see this paper).
- The model has immediate effects from fiscal consolidation. That’s because in the long run, the model is Ricardian, despite the short run rigidities introduced by sticky prices and rule-of-thumb consumers. As I’ve noted here, not all NK DSGE’s have this characteristic.
- A small point. CBO does not assume all fiscal multipliers are greater than one, as documented in innumerable reports (what’s the point of full disclosure if nobody reads!). As I’ve observed (e.g., [5]) some transfers multipliers are less than unity (as theory suggests they should).
- On a lighter note, I particularly liked the sentence: “Although CBO believes that deficit reduction may lead to lower economic growth over the short term, some economists offer a contrasting view.” It reminded me of the TV show “Ancient Aliens” where the narrator observes that some people believe “X” (Nazca lines are signs to folks from Orion, etc.). While I’m sure that there are some serious economists who do believe in the contrasting view (e.g., Taylor, Wieland), it would’ve been more honest to note where the preponderance of views in the economics profession lies.
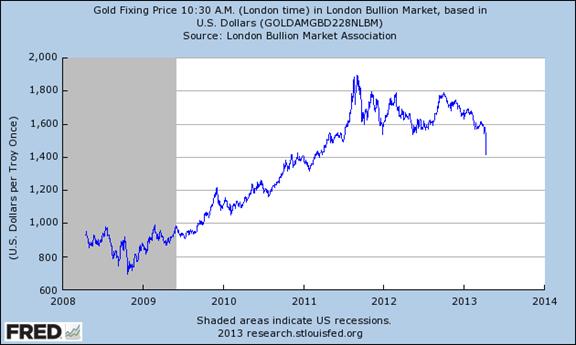
5. April: For some people, gold prices rising means policies are bad; and gold prices falling means policies are bad. I suspect gold prices trending sideways also means … policies are bad. From Gold Prices Falling:
…it is remarkable how rapidly gold prices shot up during a period of irresponsible fiscal policies, with big tax cuts and rampant government spending, denoted by the gray shaded area.
Figure 1: Price of gold bullion in dollars per troy ounce, London market, 10:30am, monthly average. Source: St. Louis Fed FRED.
Well, actually, the graph depicts the price of gold over the 1970M01-2008M12 period. That is, the sample predates the implementation of quantitative easing in the US, the UK and the euro area. The gray shading applies to the 2001M01-2008M12 period. Figure 2 depicts the log price of gold, over the 1970M01-2013M03 sample.
Figure 2: Log price of gold bullion in dollars per troy ounce, London market, 10:30am, monthly average, 1970M01-2013M03. Linear trend estimated over 2001M01-2011M08. Gray shading applies to 2001M01-2008M12. Source: St. Louis Fed FRED, and author’s calculations.
Notice that the slope of the price line is pretty straight over the 2001M01-2011M08 period. Since this is the logged price, this means that trend growth rate is pretty constant, at roughly 17.2%.
Another perspective can be seen by reference to the year-on-year growth rate of gold prices.
Figure 3: 12 month growth rate of the price of gold bullion, in dollars per troy ounce, London market, 10:30am, monthly average, 1970M01-2013M03. Linear trend rate estimated over 2001M01-2011M08 (red line). Dashed lines at QE1, QE2, QE3 start dates. Source: St. Louis Fed FRED, and author’s calculations.
Figure 3 highlights the lack of correlation of various bouts of quantitative easing and acceleration in gold price inflation. This is not surprising to informed observers of recent unconventional monetary policy measures, who are aware that increases in money base have not translated to corresponding increases in money supply (c.f., [1]). On the other hand, some movements are probably ascribable to movements in the policy rate, as Jim describes.
So why the recent drop in prices? One possibility is that expected inflation has declined from previous highs (despite the fact that expected inflation from surveys and from market based indicators have barely budged [2]). Don’t forget predictions of this nature (this one entitled subtly Hyperinflation and Gold: Losing Faith in the Dollar):
… most dangerously, through the mechanism of quantitative easing — buying government debt (Treasury bonds) in order to keep interest rates low and expand liquidity — the Fed inflates Treasury bond prices. If this Treasury debt bubble bursts, the result will be a further rush to commodities in a hyperinflationary attempt to dump dollars.
And you might then see people pushing wheelbarrows of dollar bills through the streets. …
Another (related) possibility is the expected value of the utility of gold in the post-apocalypse world has declined (because the probability ascribed to the collapse of civilization has declined). From the NYT again:
“Gold has had all the reason in the world to be moving higher — but it hasn’t been able to do it,” said Matt Zeman, a metals trader at Kingsview Financial. “The situation has not deteriorated the way that a lot of people thought it could.”
I guess in both of these interpretations, I’m assuming non-rational behavior.
Or it could be a conspiracy.
Real side interpretations focus on the fact that demand for gold has declined as there has been a downward revision in expected income growth in China, a country that has been a support to gold demand in the past.
Figure 4: London gold price, daily, 10:30am. Source: St. Louis Fed FRED.
Finally, the price decline could be the collapse of a rational stochastic bubble (something hard to verify).
6. May: Heritage Foundation assumes the Postal Service is not part of the US government in its tabulation of … government employment. From Heritage Assesses the Ever-Expanding Ever-Centralizing Federal Government Sector:
In a graphically interesting discussion of the April employment situation release, James Sherk and Salim Furth write:
State and local governments avoided the massive job losses of 2008 and 2009 that affected the private sector—these governments even grew slightly during the recession. But they have been gradually downsizing ever since. The federal government, by contrast, has expanded rapidly since the recession began. Federal employment, excluding the U.S. Postal Service,[2] peaked in 2011 at 13 percent above 2008 levels. At the same time, the private sector was still mired in the slow recovery, 5.5 percent below 2008 levels. Since 2011, federal expansion has stopped, and a fifth of the recession-era expansion has been reversed.
However, most of the federal employment expansion that took place from 2008 to 2011 remains in place. Despite protestations that the additional employment associated with the stimulus would be temporary, federal employment remains as high as it was three years ago and 10 percent higher than it was before the recession. By contrast, private, state, and local employment are 2 percent to 3 percent below pre-recession levels.The authors use the below figure to illustrate these points.
Here I provide two other ways of examining the data. Figure 1 below depicts employment levels normalized to 2007M12 levels.
Figure 1: Private employment (blue), Federal ex.-postal service (red), and state and local employment (orange), in 000’s relative to 2007M12. Federal series excludes temporary Census workers. Source: April 2013 employment release.
Now, it is interesting to observe that should one not exclude postal workers (after all, many other Federal workers are distributed throughout the nation, just like postal workers), then the picture changes somewhat, as shown in Figure 2.
Figure 2: Private employment (blue), Federal (red), and state and local employment (orange), in 000’s relative to 2007M12. Federal series excludes temporary Census workers. Source: April 2013 employment release.
In other words, Federal employment is essentially back to levels of 2007M12. I think these two graphs cast in a slightly different light the authors’ main contention, viz.:
…The expansion of the federal government has ultimately come to some degree at the expense of states and localities. As the federal government seeks to command more of the economy—most notably the health care sector—this troubling trend is likely to continue to move employment and power to the least transparent and accountable level of government
I guess it is an expansion of the center if the non-center shrinks. (Music side note: I almost expected the Darth Vader theme!)
Finally, I find it interesting that Sherk and Furth do not mention how little government employment grew relative to previous episodes.
Figure 3: Log government employment (ex.-census workers) relative to 2007M12 peak (blue), relative to 2001M03 peak (red), and relative to 1990M08 peak (green). Source: BLS, and author’s calculations.
As I recall, George W. Bush was President during the 2001M01-2008M12, when government employment surged. I do not recall a similar concern about centralization of power on the part of Heritage Foundation economists at the time.
In absolute terms, the change in government employment is 1.6 and 1.5 million lower in the current episode relative to the 2001M03 and 1990M08 episodes, respectively. …
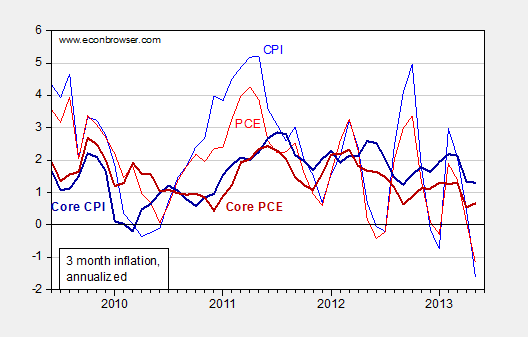
7. July. For some people, high inflation is always around the corner. From What Were They Thinking?:
As the Fed sets in place the road map to withdrawing monetary stimulus, I wonder how it is that so many believed the Fed’s implementation of unconventional monetary policy would lead to surging high inflation. Examples include House Budget Committee Chair Paul Ryan, who stated in November 2010:
I think it’s going to give us a big inflation problem down the road.
The source for the above statement, Reuters, also quotes Sarah Palin and Ron Paul.
Time to look back. Here are some graphs depicting inflation and inflation expectations as they evolved.
Figure 1: Annualized three month inflation for CPI (blue), personal consumption expenditure (red), core CPI (bold dark blue), and core PCE (bold dark red), in percent. Source: BLS, BEA via FRED, and author’s calculations.
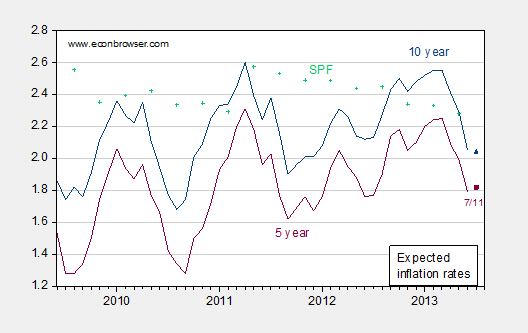
Figure 2:Expected inflation calculated from difference between 10 year constant maturity Treasuries and TIPS (dark blue), from 5 year (purple), and mean expected 10 year CPI inflation from Survey of Professional Forecasters (green +), in percent. Source: BLS, BEA via FRED, and SPF from Philadelphia Fed, and author’s calculations.
The obvious point is that there has been little evidence of inflation “getting out of control”, even as several bouts of quantitative easing were undertaken. In fact, inflation and inflation expectations have been remarkably quiescent. Why were these people so mistaken? There are at least two competing explanations, consistent with the statements that were made, and the observations we have:
- The observers were ignorant of economics.
- The observers wished to whip up hysteria in order to prevent the Fed from undertaking expansionary policies.
Both are plausible. The second possibility is more interesting to me (the first possibility is examined here). Why would these people wish interest rates to remain high? Perhaps they hoped that high interest rates would force a reduced level of government spending –- i.e., it would have “starved the beast”. In other words, instead of just cutting food stamps (SNAP) as the House is trying to do now (although not ag production subsidies [0]), even more swaths of the government could’ve been cut had monetary policy been less accommodative. Of course, the “starve the beast” hypothesis has had little empirical basis, as Jeff Frankel has pointed out (as well as Bruce Bartlett). But empirical evidence has not usually been marshalled on that side of the argument anyway.
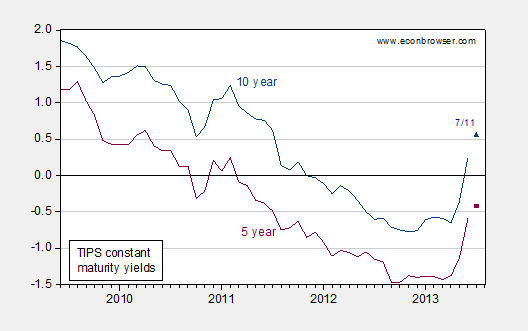
A third argument, that Fed unconventional monetary policies were ineffective, and hence should not been undertaken, seems to run counter to recent empirical evidence indicating that the imminent cessation of QE has led to higher real interest rates (after all, if QE couldn’t push rates down, why should the mention of ending it pull rates up?). The increase in real rates since the Chairman’s June speech is depicted below in Figure 3:
Figure 3: Ten year TIPS yields (dark blue), and five year TIPS yields (dark red), in percent. Source: FRED.
As Brad Delong observes, this is not good news, given that 2013Q2 GDP growth seems pretty poor. [1] Macroeconomic Advisers puts second quarter growth at 0.6% (SAAR).
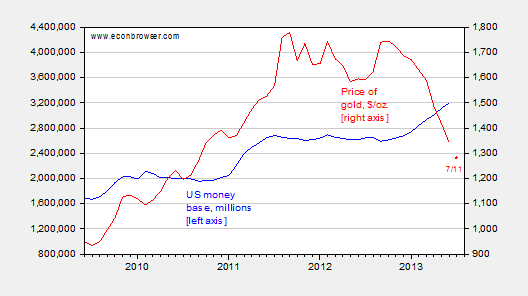
A final graph depicts money base and gold prices, for those who believe gold prices are a summary statistic for all things under heaven.
Figure 4: US money base, in millions of dollars (blue, left scale), and price of gold in London, 10:30AM, dollars per Troy ounce. Source: FRED.
Statements surrounding this graph I do think are more akin to the pure “tin-foil cap” sort (money base increase equals debasement; see this post).
I think Paul Krugman provides the perfect postscript for the attempts to avoid accountability for voicing these fears in his post Year of the Weasel.
8. September: Ed Lazear claims for Team Bush Mission Accomplished on ending the financial crisis of 2008. From The Absolute Funniest Thing I Have Read This Year:
From Ed (We Are Not in a Recession) Lazear and Keith Hennessey, “Bush ended financial crisis before Obama took office — three important truths about 2008”, FoxNews (9/16):
The financial crisis was caused principally by unprecedented capital flows into the United States (and other developed economies).
…
In September 2008 we, on behalf of President Bush, were part of a team that asked Congress to write a $700 billion check on behalf of taxpayers to bail out the failing largest banks. President Bush didn’t want to do this. We didn’t want to do this. Congress didn’t want to do it (and said no the first time). Our reservations were based on the potential cost to taxpayers and the moral hazard created by bailing out failing institutions and some of their creditors. Even today this program is famously unpopular, but the evidence is that it worked.
…
It was President Bush’s task to stop the financial panic that was occurring in the autumn of 2008. He and his administration succeeded.
…
All the major financial sector rescue policies were created and implemented during the last five months of the Bush administration.
The Bush team put Fannie Mae and Freddie Mac into conservatorship, proposed, enacted, and implemented the TARP and its main component, the Capital Purchase Program.
Treasury guaranteed money market mutual funds. The FDIC expanded its guarantee of deposit insurance and created new guarantees for small business accounts and interbank loans.
The Fed created new mechanisms for commercial paper and began paying interest on bank reserves. Fed, the Treasury, and FDIC took specific actions (many of which were loans and “bailouts”) for AIG, Citigroup, Goldman Sachs, Morgan Stanley, Washington Mutual, American Express, CIT, General Motors, and Chrysler.…
Permit me a few observations.
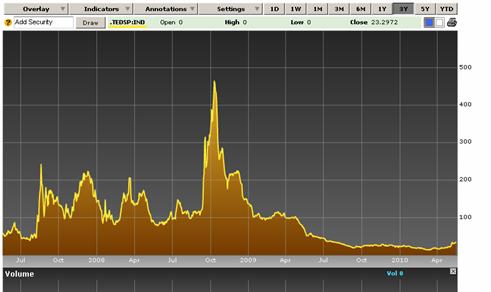
First, it’s not so clear that by January 2009, the financial system had been saved; consider the three month LIBOR-US Treasury spread (TED spread). There was clearly still a lot of distrust, as shown by the TED spread (recall, it’s likely the TED spread understated the degree of risk, given the distortions in the market). By the end of the Bush Administration, the spread shrank to where it had been in the immediate run-up to Lehman.
Source: Bloomberg via Econbrowser.
Second, the article also resurrects the “Blame it on Beijing” view of the origins of the crisis. As if all that capital flowing into America came out of nowhere — that housing boom, deregulation of financial markets, etc. had nothing to do with actual deregulatory actions pushed by the Administration. More on the “Blame it on Beijing” thesis here and here. (Heck, I got seemingly infinite numbers of offers for credit cards in 2007, but I didn’t take ’em all, borrow to the max, and then default.)
Third, I agree that the measures undertaken in the immediate aftermath of Lehman were extremely important, including the conservatorship of the GSEs, and implementation of TARP. See the discussion by Phill Swagel of crisis management during the height of crisis.
But, Lazear and Hennessey blur the distinction between Fed actions and those of the Administration. To say the Bush Administration ended the crisis overstates the case (to say the least).
Finally, the entire article reminds me of the person who builds a house in the middle of a big area of dry grass, lobbies against putting any regulations that might require tile rooftop, goes on and puts on a wood shingle rooftop, fails to clear away the dry brush surrounding the house, and then — when the house catches on fire — claims victory when one room is saved because a lawn hose was trained on that part of the house.
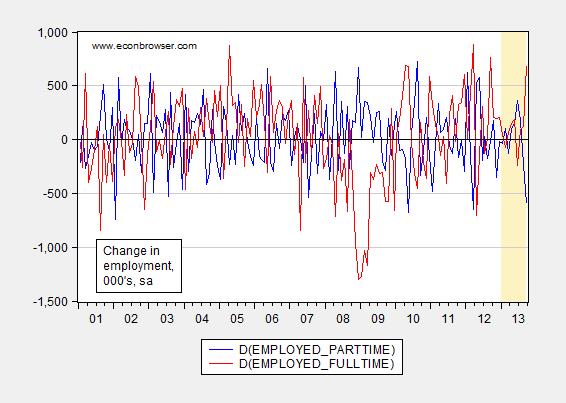
9. Is there a conspiracy so vast that it has reached all the way up the Oval Office, in order to manipulate … the part-time/full-time employment series? From Data Paranoia Watch:
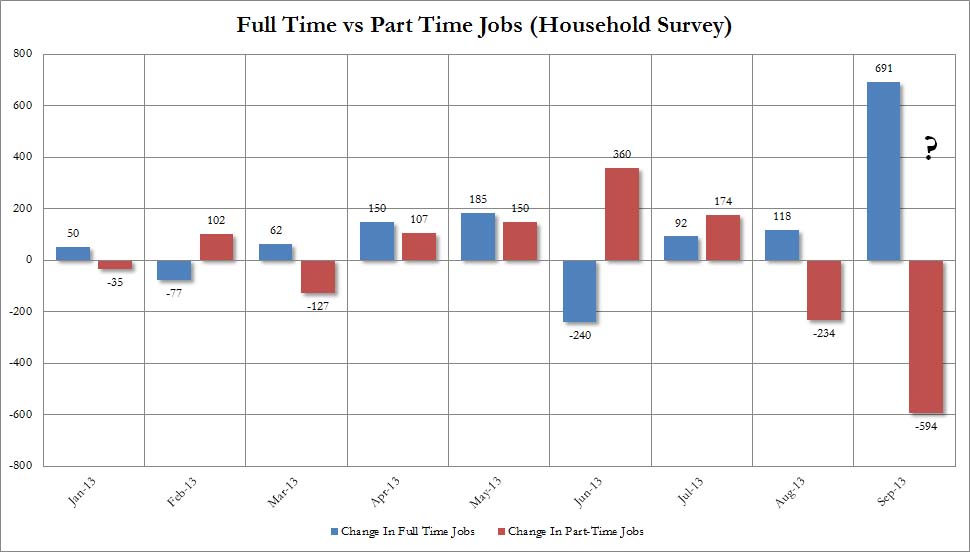
Reader Anonymous (Oct 25, 7:34AM) cites approvingly a ZeroHedge “analysis” that asserts the BLS tweaked the data to make it look like there was a big shift in employment from part time to full time. Here’s the ZeroHedge graph:
Figure from ZeroHedge.
Is this the smoking gun for a conspiracy so vast that it has penetrated the upper echelons of the BLS, straight from the Oval Office?
In order to answer this question, one has only to go to the BLS data, easily accessible on the FRED website. To convince people how easy it is to get the data, here are the two URLs: Part Time and Full Time employment.
If one plots the series over a longer time span (Figure 1), say 2001M01-2013M09, one sees that in fact the shift is quite unremarkable (the ZeroHedge sample is indicated by the tan portion).
Figure 1: First difference of employment, mostly part time (blue), and full time (red), seasonally adjusted, from CPS. Tan shading denotes sample examined by ZeroHedge. Source: BLS via FRED.
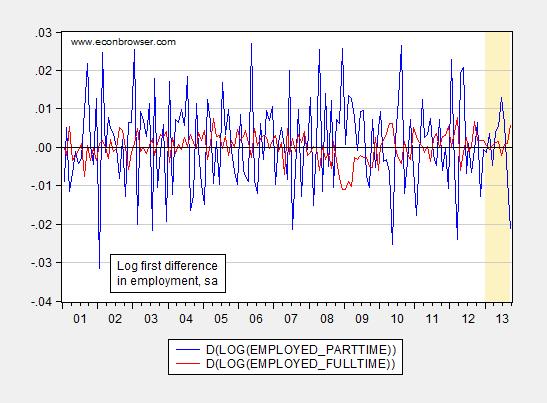
Since the civilian employment and the labor force have tended up over time, it makes sense to look at percent changes; here I measure the growth rates as the first difference of log levels.
Figure 2: Log first difference of employment, mostly part time (blue), and full time (red), seasonally adjusted, from CPS. Tan shading denotes sample examined by ZeroHedge. Source: BLS via FRED, and author’s calculations.
The September m/m percent decline in part time employment is 1.94 standard deviations from the mean (over the 2001M01-2013M09 period), while the m/m percent increase in full time employment is 1.63 standard deviations from the mean. Given the variability the series, one would not reject the null hypothesis of the September outcome occurring by random chance at the 5% msl, even for the part time series.
So, no, no vast conspiracy to distort the data to make the Administration look good.
My question: Why do these right-wing paranoid fantasies persist in an era where everybody has access to a calculator, excel, and the internet? For another excursion into the paranoid delusional world of data-conspiracies, see here. (Actually, another question: why does anybody valuing their brain cells read ZeroHedge?)
10. November: Yet more apocalyptic hyperventilating about hyperinflation. From Apocalyptic Macro: Inflation Edition:
From an opinion piece by Sean Fieler in USAToday:
If easy money delivers what it always has throughout history — growing inflation, growing inequality and growing government — a Republican embrace of sound money will offer America a way back to prosperity and the GOP a way back to a governing majority.
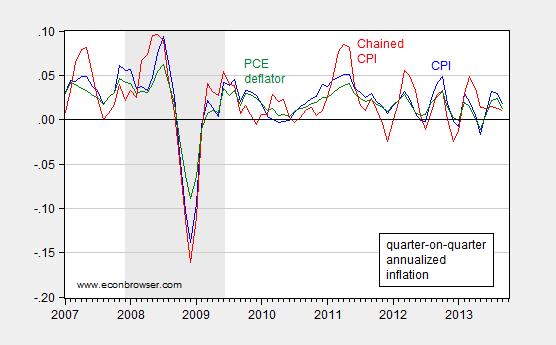
I found the reference to growing inflation of interest. Here are some data of relevance. They indicate low and declining inflation using various measures, CPI, PCE, PPI, core, headline.
Figure 1: Quarter-on-quarter annualized inflation measured by CPI (blue), Chained CPI (red), and personal consumption expenditure deflator (green). All, seasonally adjusted, measured using log differences. NBER defined recession dates shaded gray. Source: BLS and BEA via FRED, NBER and author’s calculations.
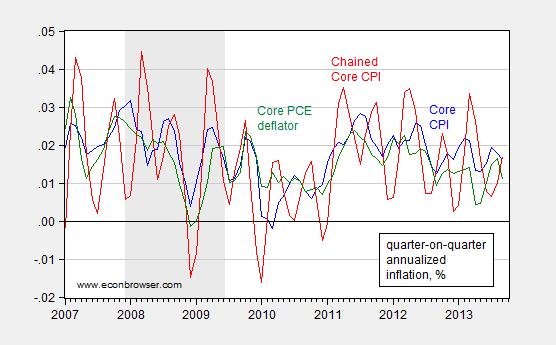
Figure 2: Quarter-on-quarter annualized inflation measured by core CPI (blue), Core Chained CPI (red), and core personal consumption expenditure deflator (green). All, seasonally adjusted, measured using log differences. NBER defined recession dates shaded gray. Source: BLS and BEA via FRED, NBER and author’s calculations.
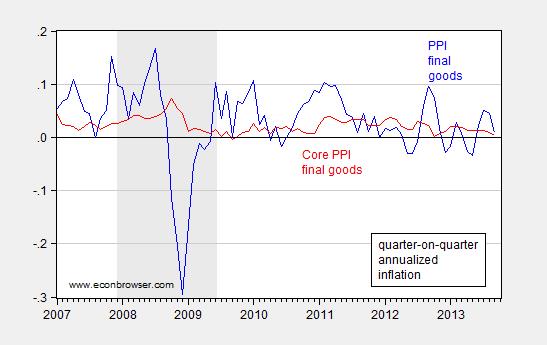
These graphs indicate low and declining headline and core inflation. Low inflation also shows up at the producer stage.
Figure 3: Quarter-on-quarter annualized inflation measured by PPI for final goods and services (blue), and core PPI for final goods and services (red). All, seasonally adjusted, measured using log differences. NBER defined recession dates shaded gray. Source: BLS and BEA via FRED, NBER and author’s calculations.
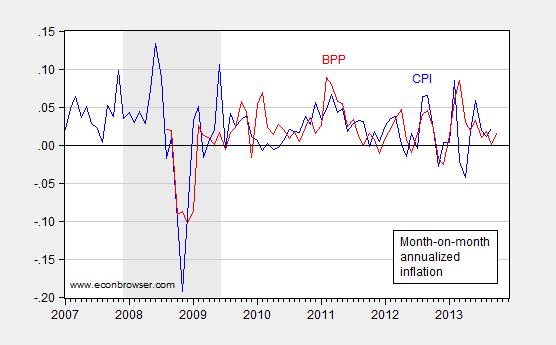
At this juncture, I’m certain the usual suspects (and others) will argue that there is a massive conspiracy in place to hide rapid inflation. I therefore appeal to a non-governmental source, namely the Billion Price Project (discussed by Jim here):
Figure 4: Month-on-month annualized inflation measured by CPI (blue), Billion Price Project (red). CPI seasonally adjusted. NBER defined recession dates shaded gray. Source: BLS FRED, Billion Price Project, NBER and author’s calculations.
Note that the month-on-month inflation measures are similar. Whatever differences exist, they are nothing like the massive differences cited by John Williams at Shadowstats (ably debunked by Jim here).
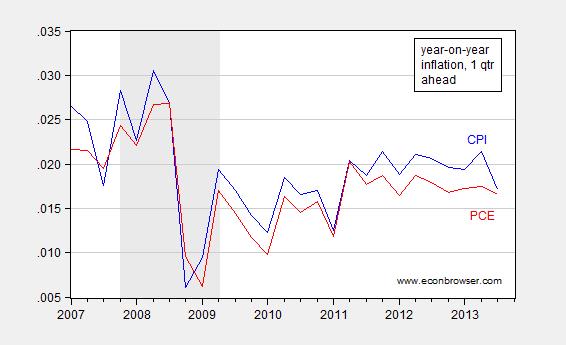
Finally, it’s of interest to note that inflation expectations have remained fairly stable.
Figure 5: One month ahead year-on-year inflation using CPI (blue), and PCE (red). NBER defined recession dates shaded gray. Source: Philadelphia Fed Survey of Professional Forecasters.
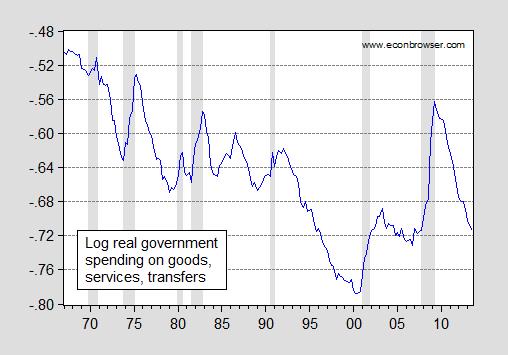
Oh, and the allegation of growing government — just look at Figure 6.
Figure 6: Log real government spending on goods, services, transfers ex-interest payments, all levels ratio to GDP. Government transfers deflated by PCE deflator. NBER defined recession dates shaded gray. Source: BEA, NBER and author’s calculations.
11. Bonus! US Treasury default is good thing! From Movements in Short Term Treasurys:
…Representative Yoho (R-FL) stated:
“I think, personally, [not raising the debt ceiling] would bring stability to the world markets.”
Somehow, I get the feeling we still might get to see this hypothesis tested in 2014. [1]
Thanks for reading. Looking forward to another year, hopefully full of better analysis!
Curiously absent from this list are any ACA claims (although that data will really come in 2014+) and an analysis of Patty Murray’s budget.
Anonymous: Re: “Patty Murray’s budget”…I thought this was negotiated with some feller named Paul Ryan. In any case, if you are looking for an analysis of the budget bill, the CBO is always a good place to start. To help you out, here is the relevant link. For estimates of the impact on growth, here is Macroeconomic Advisers’ take.
Menzie, looking back over 2013 what do you think was the one thing that you were most wrong about? This is a serious question; please don’t just attack the GOP.
Link under item two is broken.
Jake: Thanks – fixed now.
Brian: I thought the House of Representatives might actually take up some sort of immigration reform, as part of acknowledging demographic reality. I was completely, utterly, wrong on this count.
Permanent slow-motion, post-capitalist, post-Boomer boom, post-growth, post-Oil Age economic depression is the normative trend (the 5- and 10-year trend of real final sales per capita at ~0-1%) hereafter. The emerging political conditions are a consequence, not a cause.
ECRI’s Achuthan can be forgiven for failing to recognize (or incorporate into his inferences) the incremental cyclical effects of $6 trillion in deficit spending and $3 trillion in no-cost bank reserves crediting financial profits of TBTE banks at nearly 50% of total profits and 5% of GDP. There is no precedent for for the scale of hyper-financialization of an economy and its effects in encouraging leveraged rentier speculation and the biggest global asset bubble in human history.
Economists can’t see bubbles and the predictable outcomes because they are not paid by the owners of the TBTE banks to discern, acknowledge, and propose policies to restrain or first prevent bubble because Wall St. and the TBTE banks rely on serial financial bubbles for their livelihoods, rentier skimming schemes, and resulting extreme concentration of wealth, income, and political power.
Since the 1980s, bubbles are the objective of the rentier top 0.01-0.1%, not an unpredictable phenomenon no one can recognize in real time that comes to an unexpected end due to some “exogenous” event.
But the problem with bubbles for the bubblemeisters is that the more they inflate to GDP and wages, the larger the debt-deflationary effects of their bursting, implying that the next cyclical debt-deflationary episode will be unprecedented in scale, fallout, and loss of financial wealth and legitimacy of primary institutions worldwide.
People often ask in the wake of financial crashes, “Where did the money go?”. But they fail to recognize, of course, that rising financial asset prices at the margin with increasing leverage and at a log-periodic super-exponential blow-off trajectory, as we have had since “the Twist” and “all in”, is akin to a vacuum for savings, leaving the purchasing power of future returns to savings at a liquidation value FAR BELOW the level at which speculators seized by a buying panic think they will receive even in the short run.
The bubble blow-off is a mathematical definition for no or negative returns to financial assets for 10-20 years hence, absent a 40-60% decline in the meantime.
IOW, Fed/TBTE bank reserve policy is CREATING MASSIVE RISK to financial asset prices and future returns. For all the risk they are creating, the associated returns have already been had. In effect, Fed/TBTE policies are ensuring no, or negative, future growth of asset prices and real GDP per capita.
One of the big economic/political factors of 2013 was an irrational focus on deficit cuts by the US government. Australia has now taken the baton from the US and seems determined to monkey with its recovering but fragile economy with massive budget cuts in its upcoming 2014 Budget https://getcapital.com.au/blog/?p=17.
Does this make Heritage practioners of pseudo-pseudo science? There is nothing worse than crank astrologers.
Looking forward to another year of Menzie torturing Japanese economic data to show Abenomics “working” despite stagnant wages (oops), weak real GDP growth (double oops) and rising trade deficits (triple oops). Better than the “counterfactual” IIRC.
The Nikkei has done well, but nothing compared to the excellent performance of the Venezuelan stock exchange. Abe could learn something from Maduronomics.
USG will default on FED in 2014 due to debt ceiling not being raised ( or not raised enough). No one cares about too much stability, what they care for is to get the USA in stagflation , by reducing money supply and hiking oil price with Israeli attack on Iran. It only should be politically timed properly, close to November elections ( which side? probably post).
I would call 2013 a year of pseudo statistics, especially end of the year after October Debt ceiling deal. In January 2014, statistics will be bending over to ensure January FOMC taper is a hard one, > 35 billion, possibly stopping to by all govt debt.
I have no doubt at all, with the special deals to eliminate 1,3 million people from job seekers since December 28 ( gradually) that January NFP will dial 6,5% unemployment or even 6,4%! BTW that is happening on feb 7th, same day debt ceiling stops functioning.
So if USG statistics deliver, also on January 30th with GDP>4%, and December NFP about 6,8%, then debt ceiling will not be raised as in such sound economy govt must be able to balance budget. Well it can not, obviously, hence default on FED.
Default on FED will likely shoot 10 year yields up to 10% for a brief moment then relax back to 6-7%. But the key will be achieved- Q3 will show marked slowdown, Q4 – recession.
But that last one will be blamed on high oil prices . How nice! YOu cause recession and stagflation and then blame those “uncontrollable factors” like Israel attack on Iran “nuclear capabilities” and Iran and Russian helped counter attack on Saudis. And USG won’t help the Saudis , no money for military operations, austerity you know the story. And oil will nicely pop up 50% ( Brent). And no one to blame again except poor Iranians…
Heritage likes to manipulate data. I looked at their “index of economic freedom” in 2007. They have defined 10 ‘freedoms’ and merged them into a composite ‘overall freedom’ score. They then plot per capita income against that score. Now any decent statistical analysis would look at each ‘freedom’ individually. When you do that, you see the ones they focus on actually have NEGATIVE correlations. Some have statistically insignificant correlations. A few have high correlations, but they are more indicators of good governance rather than anti-tax ideology.
I emailed them about it, but no acknowledgement of the simplicity of the analysis, and no changes to their methodology.
Science is the search for truth, wherever it might be. Knowing what your conclusions are before entering analysis harms everyone because it makes people think that it is an OK way to analyze things.
There is a question I often ask some of our newer staff members when they cite a data point, with the expectation that I will be impressed – “Is that a big number?” Typically, they think it’s large until asked if it was. They often don’t know what large is for a particular data series. Your point #9 could be the result of the same sort of wide-eyed inexperience, with a big dollop of political bias on top. Problem is, there is a payoff for making strong statements without justification. Lots of dumb kids never really get much smarter because they like the payoff so much that they never learn how to do the work of thinking about the facts.
By the way, your answer to the question about your biggest mistake isn’t very satisfying, at least not to me. You aren’t a specialist in politics. The fact that you expected a political outcome that never arrived doesn’t mean very much. You are as likely to get politics right as ponies. In your area of expertise, what did you get most wrong?
Thank you Menzie for the outstanding summary of this year’s derp highlights. It is sad to think of all the other studies from Cato, Heritage, and all the other conservative BS factories that didn’t make your list. Saddest of all are the many economists who, after struggling for years in post-doc land, succumbed to the siren song of easy, six-figure incomes, resort conferences, golf, and banquets, to come up with this trash. Finally, thanks for clueing me into the latest right wing thinking on inequality–that it is caused by low interest rates and government spending from the Sean Fieler article–I will come to love that one as much as the “Martin Luther King was a conservative” line they peddled earlier this year.
Those are some pretty specific predictions, Ivars! Maybe you should get Joyce Jillison’s old job.
Why would “they” want to get the USA into stagflation? Stagflation isn’t much fun for anyone. Who is “they” anyway?
Genuine curiosity here!
Happy New Year!
Interesting how “the right” made all of this year’s errors.
Professor Chinn,
In the interest of objectivity and to provide a basis for improvement in large government interventions, are there any misjudgments made by those who favor government intervention that you could share with us?
Perhaps many readers who consider themselves as political and economic centrists could benefit from the presentation. I assume the goal is to improve the human condition, not argue about whether one is on the “left” or “right” politically or economically.
For example, looking at the mortgage debt to disposable personal income ratio, I notice that using the Federal Reserve data set Z.1, L100 (households & nonprofits), grew from about 40% in 1970 to about 100% in 2007, while home ownership increased from about 63% to about 69%. The ownership rate is back down to about 65%. Are we heading back to an unsustainable homeownership rate due to government policies?
I forgot to mention that the mortgage debt to disposable personal income is down to about 78% for 3Q 2013 compared to the 100% rate in 2007.
Ecomedian: I think you should first consider GDP growth last three quarters relative to the preceding. And then second, do the comparison in per capita terms. In other words, what you term anemic growth is not so obvious to me.
ivars: Ten year Treasurys will spike to 10%?
Heritage is wrong about Say’s law. Fiscal policy can create demand without crowding out private business… but only up to the effective demand limit.
http://angrybearblog.com/2013/12/says-law-fairy-build-it-and-they-will-come.html
I just happened to post on the same issue yesterday.
10 year Treasuries may spike shortly to 10% when USG defaults on FED. But they should settle down to 6-7% after that as more JPY gets printed to buy them and when it becomes clear it is a selective default.
But first UST 10 year will hit 4% when “unexpectedly” strong taper is announced on January FOMC back of month barrage of “unexpectedly” good economic data (esp NFP, durable goods) during January. Confirmed by Jan 30th GDP and Feb 7 NFP.
They are people who want to get gold back from places like Turkey, India, Saudi, China back to the West. They need about …35000 tons? Soon to back up USD as it is overlevereged over gold reserves as much as British pound was in 1797 (1:400). Britain fought a war, got gold to repay its lenders and had ratio reduced below 1:80 in 1821 and was able to put GBP on gold standard giving it another 100 years of life and thriving expansion in its world dominance and industrialization.
USD is at the same point now( total wealth equals total claims on USG (180 trillion roughly), so debt based money has reached its end phase. But if enough gold is collected USD can be saved.
It is more important for empire then stagflation. Idea is to do more harm to select others then to itself and get gold back.
Plans in Turkey and India are already activated, as in Vietnam. Saudis will only budhge if attacked by Iran supported by Russia. China will only stop buying sell back if state needs to borrow up to 100% GDP to save economy from private and municipal debt bubble (25 trillion?) burst and raising oil prices.
Same old storey..to finish the job China has to become debtor instead of being creditor. JPY can always be printed to by Chinese debt.. So can EUR. USD printing will be stopped and money supply contracted.
So. Japan is playing the endgame in full, moving to capital based money instead of debt ( 6 year life time), USD keeps strong currency but tolerates higher rates, EUR devalues but keeps lower rates due to bail ins. GPB follows USD tactic (predates it by few months).
Time scale for these operations is 3 years. They better come up with some gold since next moves might require Japanese approach in EUR and even USA..which leaves not much time to finish the operation of gold collection, 6-8 years after 2016 before USD evaporates. And then only global Napoleonic war 2 remains.
kharris: I did not expect Bernanke’s reiteration of the taper pre-requisites to have such a large impact on capital flows to emerging markets. The fact that it did made me rethink the efficacy of unconventional monetary policy in general, and credit easing in particular. That is, I believed they had an impact, but a modest one. I revised upward my estimates of international effects after May/June.
AS has a very good question. What about about a similar list for those who favor government intervention? Here is my top 10 list for the most egregious examples of fantastical pseudo economics from the left in 2013. Here we go:
Number 10: Paul Krugman writes of the very strong evidence for the minimum wage having very little employment effects. Krugman avers that the evidence is very strong, almost like a controlled experiment. When you look at this “evidence,” you find he’s referring to this paper. However, Krugman never tells his gullible readers of this paper, which provides a serious critique of Krugman’s very strong evidence and finds the opposite effect, that the minimum wage has significant employment effects. So Krugman is in place number 10 for his usual tactic of dramatically overstating the evidence to support his left wing cause.
Number 9: Testifying before the U.S. Committee on Small Business Subcommittee on Health and Technology, Dean Baker, of the left wing think tank “Center for Economic and Policy Research” gets significant facts about the Affordable Care Act wrong. Baker seems to think that reducing average hours below 30 hours per week would allow employers to escape the employer mandate penalties. However, Baker does not realize that the law requires that all part time employee’s hours be summed and divided by 120 to get full time equivalent employees for the purposes of the penalty. Baker refers to the $2000 penalty but does not seem to realize that the penalty can be $3000 as well, depending on the circumstances. Etc. Etc.
Number 8: As can be seen in this video, Senator Elizabeth Warren, inventing some novel labor economics, asked at a Senate hearing why shouldn’t the minimum wage be $22/hour if it had kept pace with increases in productivity?
Number 7: Showing a bit more economic obtuseness than her Senate colleague, Rep. Nancy Pelosi advances a Keynesian model in which raising the minimum wage is “is the best way to grow the economy.” You can read about it at the Washington Post
Number 6: Left wing UMass economist Michael Ash along with Dean Robinson accused Angus Deaton of coding errors, no doubt because Deaton’s result was not favorable to left wing idealogy. However, in a response to JDH’s expose on this blog, Ash posted an explanation that showed that he and Robinson had completely misunderstood the econometrics of their own critique.
Number 5: Left wing UMass economists Ash, Herndon, and Pollin accuse Reinhart and Rogoff of selectively excluding data and doing incorrect econometrics in their paper on the the effects of debt, no doubt because the results contradict left wing policy objectives. As exposed by JDH on this blog, R&R did not exclude data. Moreover, Ash, Herndon, and Pollin’s econometrics accusation revealed their own misunderstanding of panel data econometrics.
Number 4: “If you like your doctor, you can keep your doctor.” This was a widespread prediction made by politicians, policy wonks, etc. on the Left. However, you need only log onto covered california and look at plans to see that the University of California Health System is excluded. Also, New York doctors are suing United Health Care for allegedly excluding doctors from their network. There are many other examples too.
Number 3: Although called the “Affordable Care Act” it’s anything but affordable. Despite widespread predictions by left wing politicans, policy wonks, and economists that health insurance would cost less, it’s in general much more expensive. In the early days before the web site was improved, you needed to go to individual insurance websites, ehealthinsurance.com, etc. and make comparisons to see how prices have risen. But now you can go to Healthcare.gov and use their whatif calculator, which will now price policies by age and with subsidies. If you play around, you will see just how unaffordable the policies are, even with subsidies. Average Bronze and Silver deductibles of $4343 and $2567? Ouch!!
Number 2: “If you like your plan, you can keep your plan.” The President and numerous Democratic politicians repeated this promise over and over, despite the economics that suggested that it must be false. Ultimately, the President was forced to apologize to the American people while Time magazine called the promise the “Lie of the Year.” But that didn’t stop Sen Harry Reid from saying that the promise was nonetheless true in this video.
And, drum roll please, the Number 1 example of economic nonsense from the Left in 2013 is…
Number 1: Refusing to agree with Republican critics that ACA is not ready for prime time that needed to be delayed, the Administration preferred to shut down the government. But very soon, events revealed that the Republican critics were completely right, as the Administration delayed most of Obamacare by executive fiat:
— delaying employer mandate for a year
— allowing insurance companies to renew policies that were in place in 2013
— moving deadline to Dec 23 and moving payment dates into January
–creating a hardship exemption that allows people to get catastrophic plans or not pay the penalty if plans were judged by the consumer to be unaffordable
If the Administration had only acknowledged that the Republican critics were right a little earlier, the government shutdown could have been averted.
Happy New Year to all.
Rick Stryker: Wow. Well, re: the size of impact of the minimum wage, see Figure 1 in this paper. I’m sure you’ll find a way to exclude in your own mind the studies that find near zero impacts, but for the rest of us tethered to reality, I think Krugman’s characterization is fair.
I’m surprised using log-ratios didn’t make your top ten!
Rick Stryker I think you’re overstating the conclusions by Neumark, Salas and Wascher regarding the effects of the minimum wage. It is true that they were able to find statistically significant negative employment effects, but even they concede that the negative effects are not large:
We have never claimed that the disemployment effects of minimum wages are large. Nor have
we claimed that they necessarily imply that minimum wages cannot help poor and low-income families (Neumark and Wascher, 2008, p. 190), although the much more limited evidence suggests that on net they do not. But we believe that the research record still shows that minimum wages pose a tradeoff of higher wages for some against job losses for others, and that policymakers need to bear this tradeoff in mind when making decisions about increasing the minimum wage.
Also, their paper focuses on the unemployment rate, which is not quite the same thing as employment. It’s not hard to show how the minimum wage could increase employment while also increasing the unemployment rate. In any event, Krugman’s point was that there is no evidence that raising the minimum wage (within reason) would have the catastrophic employment effects that op-ed writers at the WSJ would have you believe. And the authors you cited agree with that.
I think you are misreading and misunderstanding Dean Baker’s point. You seem to believe that Baker was whining about possible loopholes in the law. That is not what Baker was saying. In fact, he was saying exactly the opposite. His testimony argues that the provisions in the ACA are sufficient to discourage employers from doing the kinds of things that conservative critics were saying would happen under the ACA. Please re-read what Baker was actually saying.
Your #1 item on the ACA not being ready for prime time is a very strange interpretation. Clearly the website was not ready for prime time, although the website seems to be working quite well right now. I fail to see how minor adjustments such as slipping dates by 24 hours constitute a serious critique. And are you saying that the Administration should not have delayed the employer mandate? Look, the substantive critique of Obamacare wasn’t about delaying the employer mandate, or extending the deadline by one day, or creating temporary hardship exemptions or any of the other junk you mentioned. Those are all just the normal fixes, tweaks and adjustments that come with implementing every program of any significance. The real GOP critique of Obamacare is the one that Sen. Ted Cruz offered; viz., that once people understood it they would like it and it would be impossible to reverse. The GOP critique was not that Obamacare wouldn’t work, but that it would work.
Finally, regarding the R&R v HAP issue, I think you are mischaracterizing the issue. I don’t think HAP ever said that R&R “selectively” excluded data. My reading of their paper is that they simply pointed out that some countries were excluded in the original R&R paper…which is true and a point that R&R concede. That’s the infamous Excel copy/paste error. And HAP never said that this was a big deal. The guts of the HAP critique was the weighting technique used by R&R. Apparently you (and perhaps JDH) believe that a fixed effects model with one observation for many of the individual countries is meaningful. I don’t. To me that is a bizarre weighting technique. Notice that HAP were not criticizing fixed effects models in general, just those that try to discern fixed effects based on one observation for many of the countries.
“fixed effects model with one observation for many of the individual countries”
Exactly. Just take a second to think through what fixed effects are doing in the model. Ask yourself what is being “fixed”, and you will see what is wrong with combining multiple observation into one.
It is a grad student error, the kind of thing you see at a regional conference presented by a first year grad student. It is exactly why I still defend the peer-review process, it would have never made it passed reviewers. Working papers should not have this level of influence…
Menzie,
Krugman highlighted a particular study, the one I referenced, saying this about it:
“It’s important to understand how good this evidence is. Normally, economic analysis is handicapped by the absence of controlled experiments. For example, we can look at what happened to the U.S. economy after the Obama stimulus went into effect, but we can’t observe an alternative universe in which there was no stimulus, and compare the results.
When it comes to the minimum wage, however, we have a number of cases in which a state raised its own minimum wage while a neighboring state did not. If there were anything to the notion that minimum wage increases have big negative effects on employment, that result should show up in state-to-state comparisons. It doesn’t.”
Krugman makes it sound like this is a controlled experiment that can’t be criticized. However, although study I cited in response, Neumark, Salas, and Wascher, directly challenges that across-state comparison methodology, Krugman did not mention that study. Thus, Krugman overstated the case for how strong the paper’s results really were.
I’m aware of the other paper you cite. However, probably the most comprehensive review of the minimum wage literature is available in this book, which disagrees with Krugman’s assertions. Krugman deserves 10th place for misleading his readers into thinking his case is much stronger than it really is.
By the way, I love how Krugman acknowledges the weakness of the multiplier arguments in order to strengthen the case for his latest cause, minimum wage increases.
Re #11. The quote you post says nothing of default, rightfully, as default was never going to happen. Now Yoho is correct that not raising the debt ceiling would bring stability. Not continuing the ridiculous spending shows someone with some sense if finally taking control.
2slugbaits,
Those aren’t minor delays I listed for ACA. They are major delays which no one dreamed that the Administration would decide to do on their own. But they were forced to do it because of the outcry.
On Dean Baker, I think you misunderstood my comment. Here is the relevant section, where I have bolded the key misconception:
“The alternative course of evading ACA penalties, reducing average hours of work below 30 per week, could at least plausibly have an impact on employment patterns. In fact, several large employers have claimed that they would deliberately keep workers’ hours below 30 hours per week in order to avoid having them count toward the number for whom they would have a $2,000 penalty.
It is possible to test whether employers are actually reducing hours below the 30-hour threshold. The Current Population Survey (CPS) provides monthly data on workers usual weekly hours. We used the CPS to compare the first six months of 2013 with the first six months of 2012. Our original focus had been on the group of workers who reported working 26-29 hours a week. We considered this range a reasonable cutoff for an ACA effect. Presumably if an employer would have a worker put in more than 30 hours a week in the absence of ACA penalties, they would require a worker to put in close to, but less than, 30 hours in order to avoid the penalties.”
Baker then proceeds to look at hours in the 26-29 category to show that they haven’t changed significantly.
But that’s not the way the law works. You don’t get out of the penalty by reducing hours to something just under 30 so that workers aren’t counted. The law requires you to sum the monthly hours for all part time employees and then divide by 120 to get full time equivalents for the purposes of judging the 50-employee threshold. Thus, Baker’s analysis is irrelevant. He could have refuted the idea that employers will cut hours below 30 just by citing the way the law actually works rather than doing irrelevant analysis.
On the minimum wage, please see the book I linked to in my response to Menzie.
On R&R, I think we are beating a dead horse on that at this point.
Re: #1 (MN vs WI, under Walker)
As a Minnesotan, I’ve been rather surprised how Walker keeps beating this horse, considering how far behind he is. I suppose WI may eventually show some growth vs 2008 (or some other sufficiently distant time in the past that Walker can eventually beat his chest over a delayed post-recession recovery in WI), but I think it’s worth noting in your analysis and/or graph when Walker took office.
January 2011. It’s not hard to find – it’s when Wisconsin’s recovery (which had at least been parallelling its immediate neighbor to the west) ran into a glass ceiling.
Oh well. Walker is now following Act 1 by talking about eliminating Wisconsin state income taxes (and replacing them with…um, cheese?) and the usual suspects that voted him in are eating it up.
Two of the most interesting revelations of 2013 are related. Menzie promotes 100% of Americans be on the Food Stamp/SNAP program so the government can ration food for everyone in the country and Menzie wants the government to have total control of the healthcare system. With these two acquisitions the government would control the life and death of every person in the country to keep them politically correct. This would give government control of more than 50% of the total GNP of the country. Add in the fact that the now government programs of Fannie and Freddie control more than 90% of all mortgages in the country and you have to ask what is left. Menzie may not come right out and promote total socialism in the US but there is little doubt that this is his objective.
Rick Stryker Again, you are misunderstanding Baker’s point. As best I can tell, your argument seems to be that Baker was utterly clueless about the actual provisions of the law. I think this is unlikely since Baker was one of the first to point out the very provisions you seem to think he didn’t know about. Baker isn’t a spring chicken, but I don’t think Alzheimer’s has set in quite yet. Here’s a more plausible interpretation of what Baker was saying. When Baker was talking about reducing the number of hours to something below 30 in order to avoid the ACA penalties he was setting that up as a straw man. The claim that employers would reduce hours below 30 was something that you heard from critics of Obamacare. It’s what you read on the op-ed pages of the WSJ. That’s what business roundtable types were claiming. That’s what some on this blog were claiming. One answer would be to point out the actual provisions of the law regarding…and I believe I was the very first person on this blog to actually point the requirement to sum all hours and divide by 120 hours each month (it was in a reply to Brian about a year ago). Now I’m not terribly bright, so I had to rely upon following Dean Baker and his highlighting this feature of the law…that’s why I’m fairly confident that Dean Baker was quite aware it. But in his testimony Baker was not playing the role of labor relations lawyer, but of economist, and that is why his response focused on the economic aspects and assumed for the sake of argument that employers would be allowed to do what they claimed they would do. Also, just because many employers and the op-ed pages of the WSJ may have been mistaken about the provisions of the law, that does not mean they might not have acted upon an erroneous understanding of the law by cutting hours to something under 30. In his testimony Baker offered an economic rationale (as opposed to a legal rationale) explaining why employers would not do what the op-ed pages of the WSJ were claiming. Like I said, you need to re-read Baker’s testimony with an eye towards understanding what he was actually saying rather than just looking for some manufactured “gotcha”.
Regarding the minimum wage, I think you need to learn the difference between statistical significance and policy significance. The authors of your favorite paper only found statistical significance, but even they admitted that the magnitude of the effect of the minimum wage on the unemployment rate is not very large.
I agree that the R&R debate is a dead horse. After the HAP paper several other economists piled on and found even more devastating critiques; e.g., Miles Kimball. The R&R thesis is now where it belonged all along…in the dustbin.
2slugbaits,
Yes, that is my point. Dean Baker and his CEPR colleagues are utterly clueless about a key feature of the ACA. Instead of looking at Baker’s very words, which show that he doesn’t understand the point, you claim that he indeed does understand this point really. You claim that you learned the point from him sometime last year but you provide no link or evidence. If you learned it from Dean Baker, can you please provide the link where he said it? Also, if you claim to have said it to Bryan, can you provide the link to back up your claim.
For evidence to the contrary, please note that Helene Jorgensen and Dean Baker wrote a CEPR paper in July 2013, available here in which they explicitly get the point wrong. Here is a quote from the intro:
“There are two obvious ways to avoid the sanctions. First, firms can keep the total number of workers at a firm under 50, and in this way avoid being subject to sanctions.
Second firms can reduce the number of hours that employees work so that they fall under
the 30 hour a week average that would have them count towards the firm’s penalty under the ACA.”
On R&R, I didn’t think it worth it to rehash the same arguments again. But the fact is that HAP’s point about the R&R weighting is demonstrably wrong. I wrote down the key panel data equation to illustrate that point in past comments.
On the minimum wage question, you should read the book I linked to. It’s not just a matter of statistical vs. economic significance.
They are people who want to get gold back from places like Turkey, India, Saudi, China back to the West. They need about …35000 tons? Soon to back up USD as it is overlevereged over gold reserves as much as British pound was in 1797 (1:400). Britain fought a war, got gold to repay its lenders and had ratio reduced below 1:80 in 1821 and was able to put GBP on gold standard giving it another 100 years of life and thriving expansion in its world dominance and industrialization.
USD is at the same point now( total wealth equals total claims on USG (180 trillion roughly), so debt based money has reached its end phase. But if enough gold is collected USD can be saved.
It is more important for empire then stagflation. Idea is to do more harm to select others then to itself and get gold back.
Plans in Turkey and India are already activated, as in Vietnam. Saudis will only budhge if attacked by Iran supported by Russia. China will only stop buying sell back if state needs to borrow up to 100% GDP to save economy from private and municipal debt bubble (25 trillion?) burst and raising oil prices.
Same old storey..to finish the job China has to become debtor instead of being creditor. JPY can always be printed to by Chinese debt.. So can EUR. USD printing will be stopped and money supply contracted.
So. Japan is playing the endgame in full, moving to capital based money instead of debt ( 6 year life time), USD keeps strong currency but tolerates higher rates, EUR devalues but keeps lower rates due to bail ins. GPB follows USD tactic (predates it by few months).
Time scale for these operations is 3 years. They better come up with some gold since next moves might require Japanese approach in EUR and even USA..which leaves not much time to finish the operation of gold collection, 6-8 years after 2016 before USD evaporates. And then only global Napoleonic war 2 remains.
rick stryker
“Number 1: Refusing to agree with Republican critics that ACA is not ready for prime time that needed to be delayed, the Administration preferred to shut down the government. ”
stryker, I guess you won’t admit the reason for a republican delay was to create time to try and repeal the law and not improve it for prime time. but that is exactly what was happening. please don’t faux spin the story. you can try to spin any way you like, but that was a republican dictated government shutdown. your alternate reality is truly baffling! obamacare is working just fine at this time-and I know that is a scarey reality for you to behold!