I was interviewed for an NPR piece run today:
For those who put weight on data, see these graphs.
Wisconsin’s outlook has deteriorated recently [post]
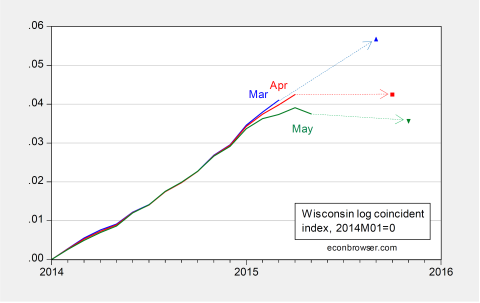
Figure 1: Log coincident index for Wisconsin, from March release (blue), April (red), and May (green), and associated implied forecasted levels. All normalized to 2014M01=0. Source: Philadelphia Fed coincident, leading, and author’s calculations.
The already lackluster BLS (establishment) employment figures for Wisconsin are likely to be revised down [post]
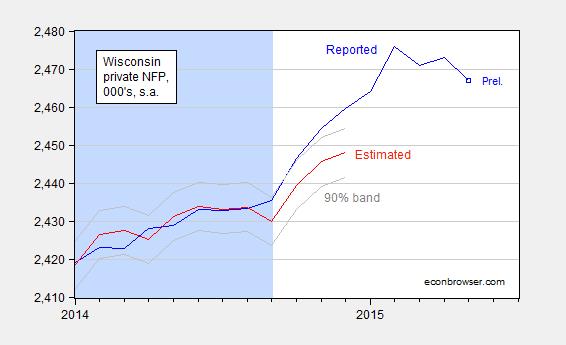
Figure 2: Wisconsin private nonfarm payroll employment (blue), and predicted (red). Light blue shading denotes data used for regression. Source: DWD and author’s calculations.
Real output measures demonstrate Wisconsin growth lags, despite having a high ALEC economic outlook ranking [post]
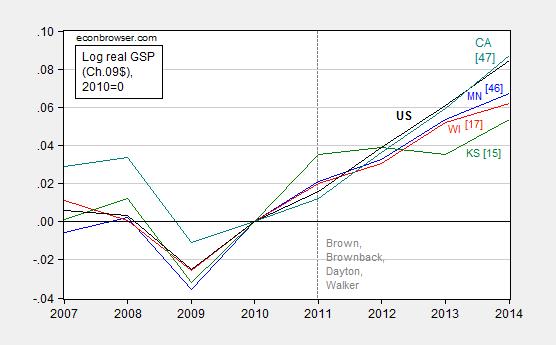
Figure 3: Log Gross State Product for Minnesota (blue), Wisconsin (red), Kansas (green), California (teal), and United States (black), all normalized to 2010=0. 2014 figures are advance. Numbers in [square brackets] are ALEC-Laffer rankings from Rich States, Poor States, 2014. Vertical dashed line at beginning of Brown, Brownback, Dayton and Walker administrations. Source: BEA, ALEC RSPS 2014, and author’s calculations.
Wisconsin ranks dead last for start-ups, despite Governor Walker’s goal of creating thousands of new companies [post]
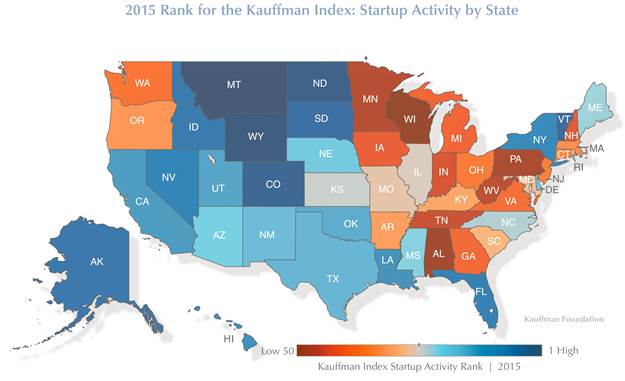
Source: Kauffman Foundation, State and Metro Trends.
Wisconsin’s economic performance since 2011M01 deviates — with statistical significance — from the historical norm, established using a model incorporating long run slower growth of the Wisconsin economy relative to the US economy [post]
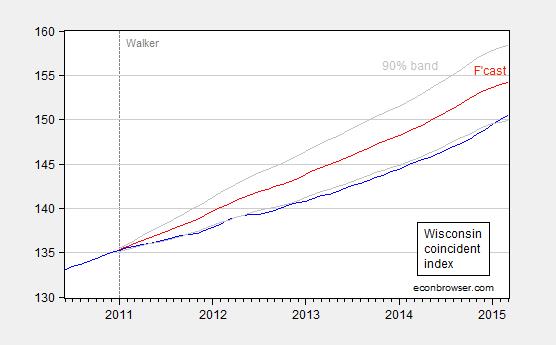
Figure 4: Coincident index for Wisconsin (blue), forecast (red), and 90% confidence band (gray). For forecast, see text. Source: Philadelphia Fed and author’s calculations.
Bonus: It’s not just nonfarm payroll employment. Civilian employment also declines [post]
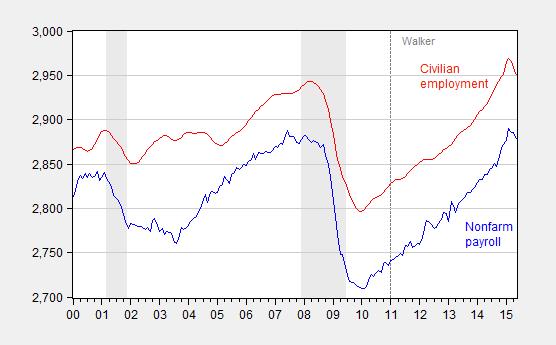
Figure 5: Wisconsin nonfarm payroll employment (blue) and civilian employment (red), both seasonally adjusted, 000’s. Source: BLS.
Site visitors who put weight on data should recognize that Professor Chinn’s analysis shown in Figure 3 and Figure 4 in the post above is highly deficient. While Chinn’s methods would produce valid insights if they were applied properly, Chinn is attempting to apply them to the Philadelphia Fed’s state coincident indices data to create a comparative ranking system between states, which the Philly Fed has specifically described as being an invalid use of their data. You can read the statement they provided to the Capital Times’ in responding to a previous misapplication of their data at the following link:
http://host.madison.com/philly-fed-email/html_980929dc-27c9-11e3-bf0e-001a4bcf887a.html
Aside from that issue, readers should also note that the state coincident data is highly volatile and produces large changes and revisions from previously reported figures month, which Professor Chinn has not acknowledged in Figure 1, which would otherwise be a more valid use of the state coincident index data. Unfortunately, Professor Chinn has also not provided any supporting contextual information to explain any causes for the changes recorded in the data from one month to the next, which is a chronic deficiency in the analysis Chinn has provided regarding the performance of Wisconsin’s state economy. If you compare the series to Chinn’s recent analysis of China’s stock market decline, you’ll see quite a dramatic difference in the quality of analysis on that count.
Ironman: I see you continue your campaign of disinformation. Interested readers should consult this previous exchange where we disposed of this issue. I will quote from a document that you yourself have quoted approvingly before, and hence should be aware of (unless you just go through documents cherry-picking items that will support your argument, and ignoring the rest — entirely plausible):
In other words, well the coincident indices get revised sometimes substantially because, well, all the other data we report get revised substantially, including employment etc. Do you ever use employment data?
Now what explains the divergence between the text and the assertion you stated. Well, as far as what I can tell, in the Philly Fed email, the statement “We do not consider state rankings based on the coincident and leading indexes to be valid.” — means don’t rank states by the index. OK, I don’t think I’ve ever written Wisconsin grows Xth out of 50 states over the past year, using the coincident index. That’s because I don’t like rankings, preferring the data incorporated in the original data (I use rankings when the data are given to me that way, such as the ALEC-Laffer-Moore-Williams economic outlook, and I cannot retrieve the underlying index.) However, read the final line of the email:
It strangely sounds like the Philly Fed document I quoted above (and you have quoted before). Well, because it says the same thing. So…if you are against comparing (not ranking) GSP — or GDP for different countries — you have no backing for your argument. Indeed, from the webpage where the Philadelphia Fed coincident indices are located, you conveniently ignore this line: “The model and the input variables are consistent across the 50 states, so the state indexes are comparable to one another.”
Thanks again for making my morning by showing your mendacity at its most glaringly inept. I look forward to your next comment!
[I have to say this is pretty rich for a person that reports data series over long spans of time in nominal terms in his/her blog!!!!. Wonders never cease!]
Figure 3 and 4 are the least devastating of them (although as the Professor points out there is nothing wrong with them). Dead last for startups is probably the worst (for a person who was going to make the state business friendly and create an economic miracle from all those new activities).
Here’s another map from the Pew Charitable Trusts – “…numbers for states released last week by the U.S. Department of Commerce Bureau of Economic Analysis (BEA)” – June 2015:
http://www.pewtrusts.org/en/research-and-analysis/blogs/stateline/2015/6/17/most-states-show-economic-growth
And, there isn’t much difference between startups in Minnesota and Wisconsin, although Minnesota has a higher educated population, e.g. for emerging industries. Also, it looks like a regional phenomenon. List:
http://www.kauffman.org/microsites/kauffman-index/rankings/state
Peak Trader: Governor Walker made it a point that he would create at least 10,000 new startups. I do not recall a comparable commitment from Governor Dayton, but I would welcome your documentation of said claim.
Menzie, it used to seem that MN as doing better in relation to WI on your other posts about this topic (see Figure 3). Now the MN performance has gone south and that does present a plausible regional explanation beyond austerity. Any ideas on what changed in the relationship between MN and WI? Is it just for Log Gross State Product? Is it the same now using the other indicators that you have used? Because I remember a further separation between the two…
XO: First, the GSP values for 2014 are preliminary. They will be revised subsequently, but even when they are, they will not exactly match the annual averaged data of the coincident indices.
If you examine the coincident indices as of June (see this post) you will see that Minnesota outperforms Wisconsin still, normalized on 2011M01 (essentially, one normalizes on mid-2011 when using annual data).
Interestingly, quarterly real GSP figures indicate a greater coherence between GSP and coincident indicators. See this post.
It would seem that the issues in the midwest seem to be with the predominantly Democrat Party controlled metropolitan areas.
http://www.kauffman.org/microsites/kauffman-index/rankings/metropolitan-area
Why are those cities such a drag on those states?
Then again why are 9 of the 10 poorest states red states?
http://www.politifact.com/rhode-island/statements/2014/mar/28/occupy-democrats/pro-democrat-group-says-9-10-poorest-states-are-re/